
Hello, Shiny for Python users. We have some great new features for you in the latest release!
Introducing data grid / data table
We’ve added a new, fast-scrolling data table output.
It can easily handle tables with tens of thousands of rows, and supports sorting by columns – just click on the column header to sort.
In addition to the grid-style appearance, the data can be displayed with a more traditional table-like appearance.
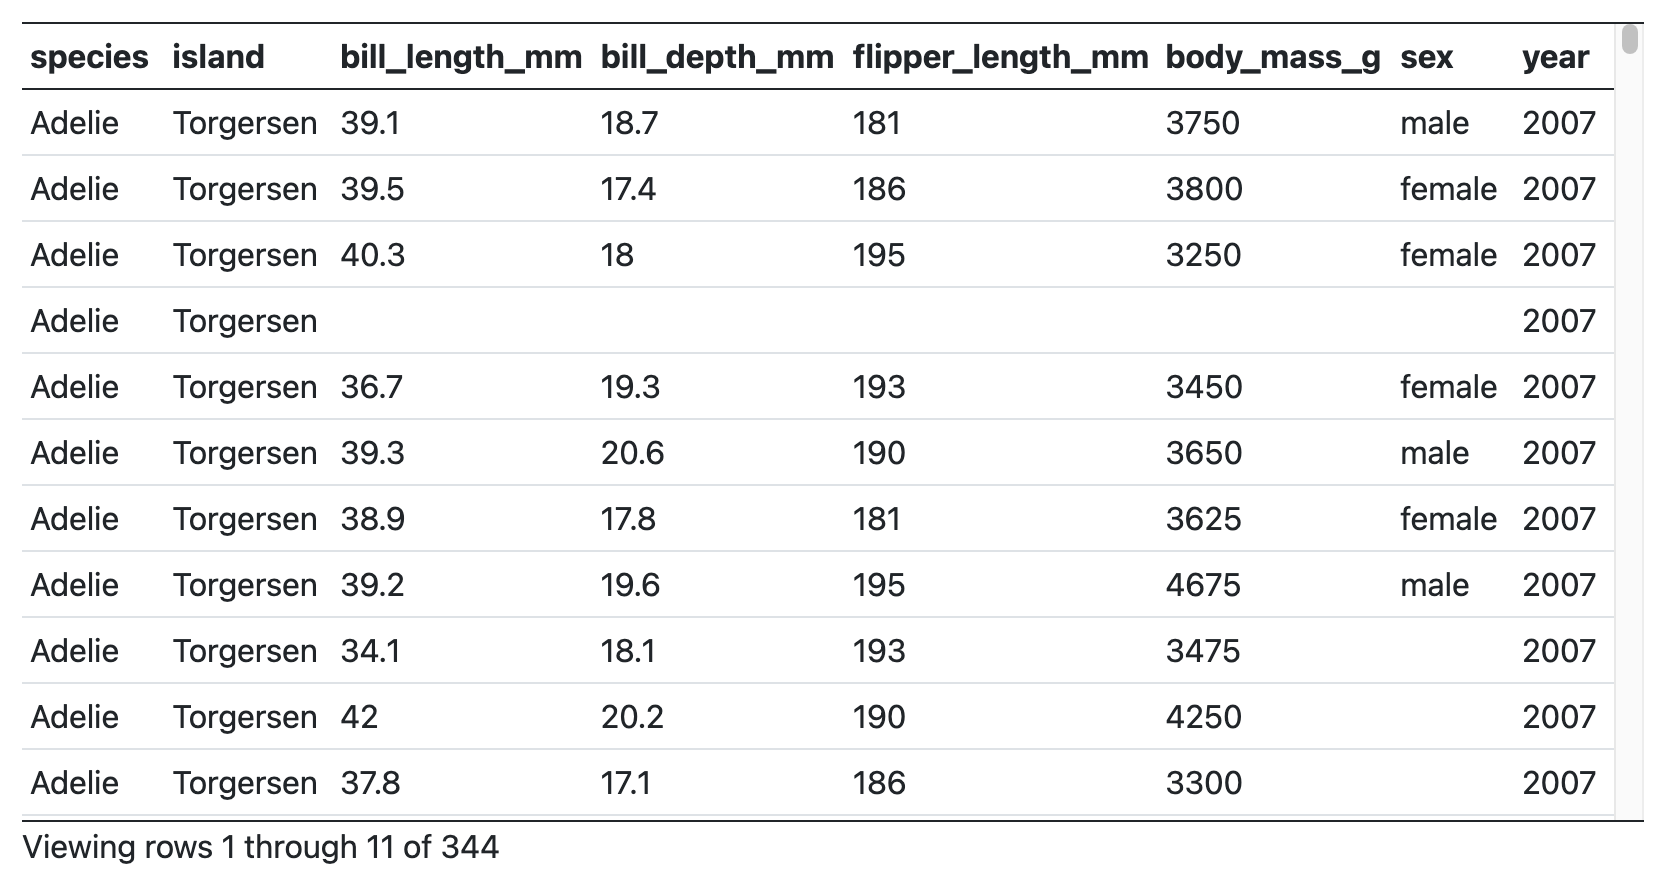
These tables aren’t just for displaying data – they can also allow you to select rows, use that selection as an input, as shown here:
To use the new tables, put this in your application’s UI:
ui.output_data_frame("mygrid")And in your server function, use @render.data_frame and give it a function that returns a render.DataGrid(); in turn, that function a Pandas data frame.
  @output
  @render.data_frame
  def mygrid():
    return render.DataGrid(my_df)
To get the more traditional table-like styling, return a render.DataTable() instead.
Better-looking sidebars
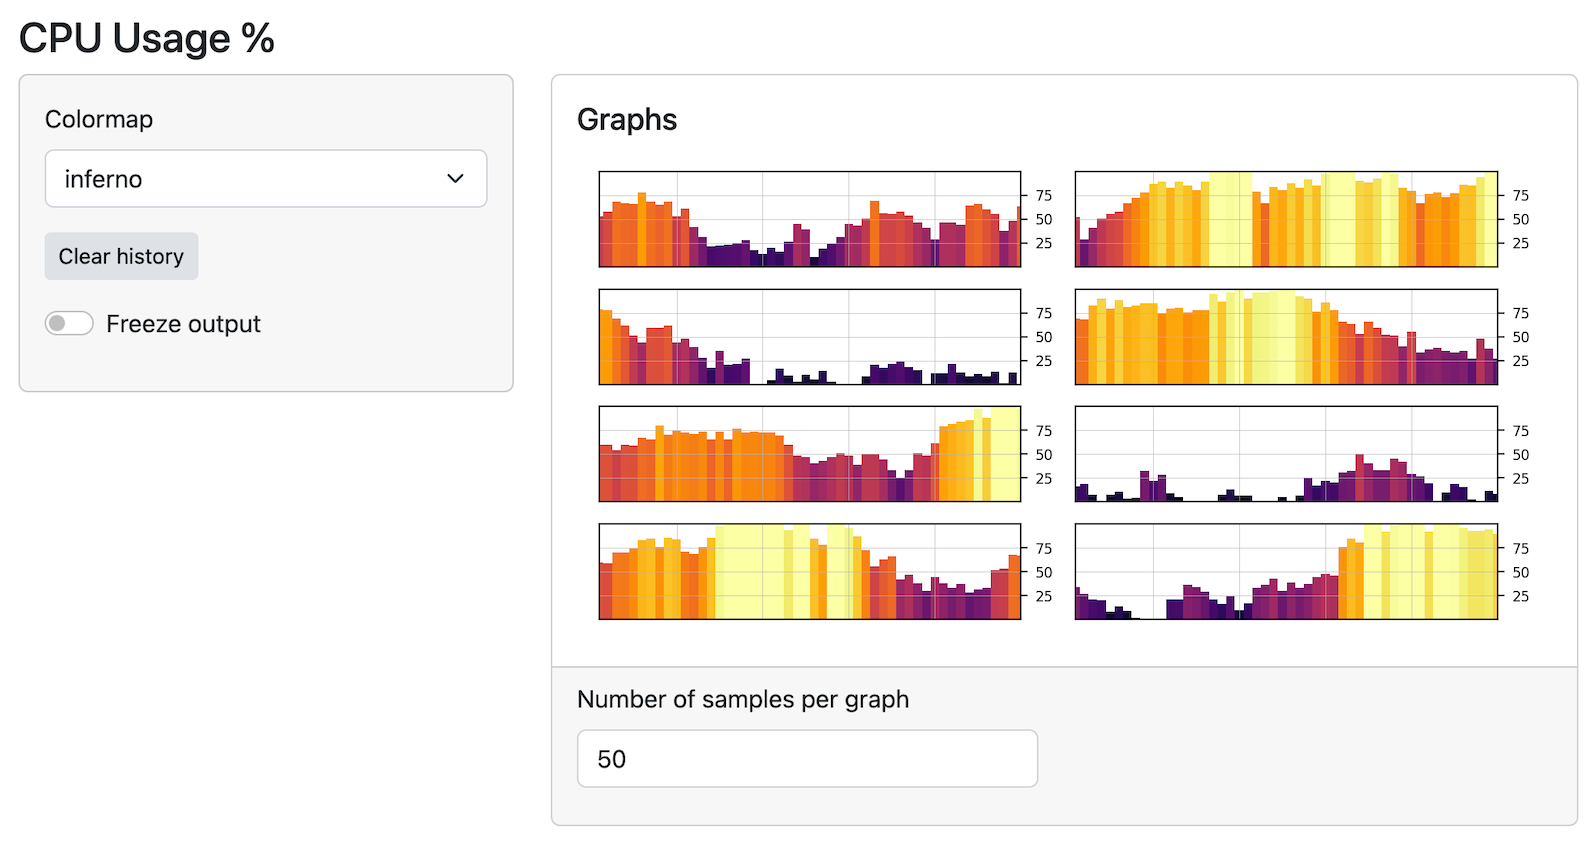
In addition to the new tables, we’ve also improved the look of the basic sidebar. Here’s what they used to look like:
Previously, the sidebar was only as tall as the content in the sidebar, but now they span the full height of the application. Here’s what they look like now:
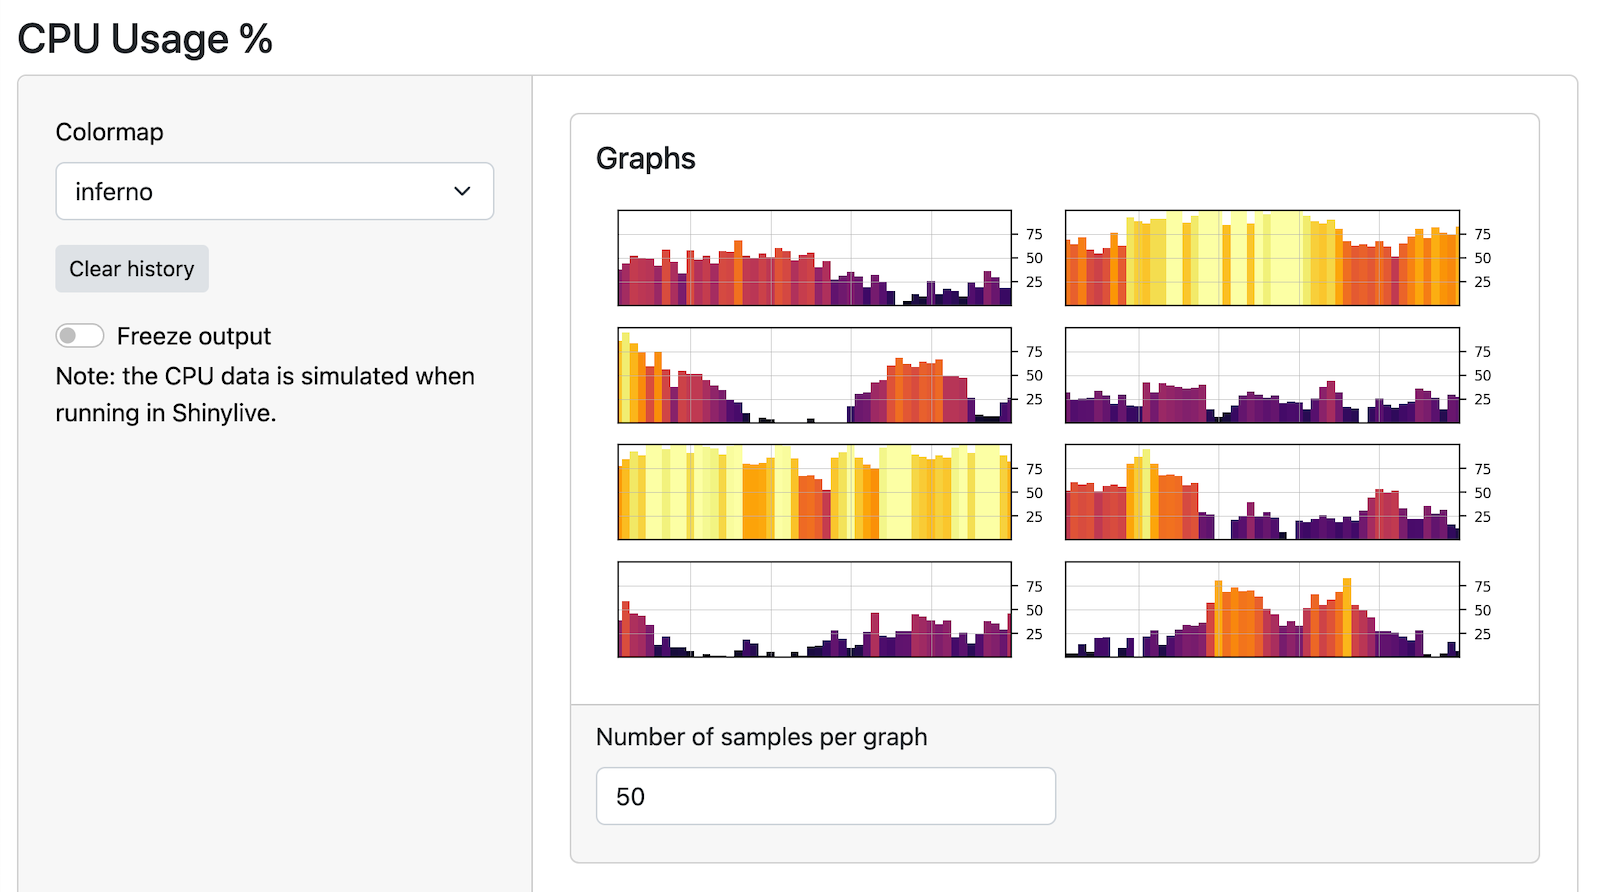
You won’t have to change any code to get the new look – your existing code will just work!
Check out a live example here.
Enjoy!