OpenTelemetry
Introduction
Understanding how your Shiny application behaves in production is critical for maintaining performance and reliability. While local development gives you some insight, production environments introduce complexities like concurrent users, varied network conditions, and unexpected usage patterns.
OpenTelemetry provides a standardized way to collect observability data from your Shiny applications, helping you answer questions like:
- Why is my app slow for certain users?
- Which reactive expressions are taking the most time?
- How long does it take for outputs to render?
- What sequence of events occurs when a user interacts with my app?
Starting with Shiny v1.6.0, OpenTelemetry support is built directly into the framework, making it easier than ever to gain visibility into your applications at scale.
Already familiar with OpenTelemetry?
What is OpenTelemetry?
OpenTelemetry (aka OTel) describes itself as “high-quality, ubiquitous, and portable telemetry to enable effective observability”. It is an open-source observability framework that provides a vendor-neutral way to collect telemetry data from applications. OTel standardizes three types of observability data:
Traces: Show the path of a request through your application. In Shiny, a trace reveals how a user’s input change triggers a cascade of reactive calculations, ultimately updating outputs. Traces help you understand the sequence and timing of operations.
Logs: Detailed event records that capture what happened at specific moments, including errors, warnings, and informational messages.
Metrics: Numerical measurements collected over time, such as request counts, response times, or resource utilization.
These data types were standardized under the OpenTelemetry project, which is supported by a large community and many companies. The goal is to provide a consistent way to collect and export observability data, making it easier to monitor and troubleshoot applications.
The OpenTelemetry ecosystem
OpenTelemetry is vendor-neutral, meaning you can send your telemetry data to various local backends like Jaeger, Zipkin, Prometheus, or cloud-based services like Grafana Cloud, Logfire, and Langfuse. This flexibility means you’re not locked into any particular monitoring solution.
We’ve been using Logfire internally at Posit to help develop OTel integration in many packages and other applications. Throughout this article, you’ll see examples of OTel traces visualized in Logfire.
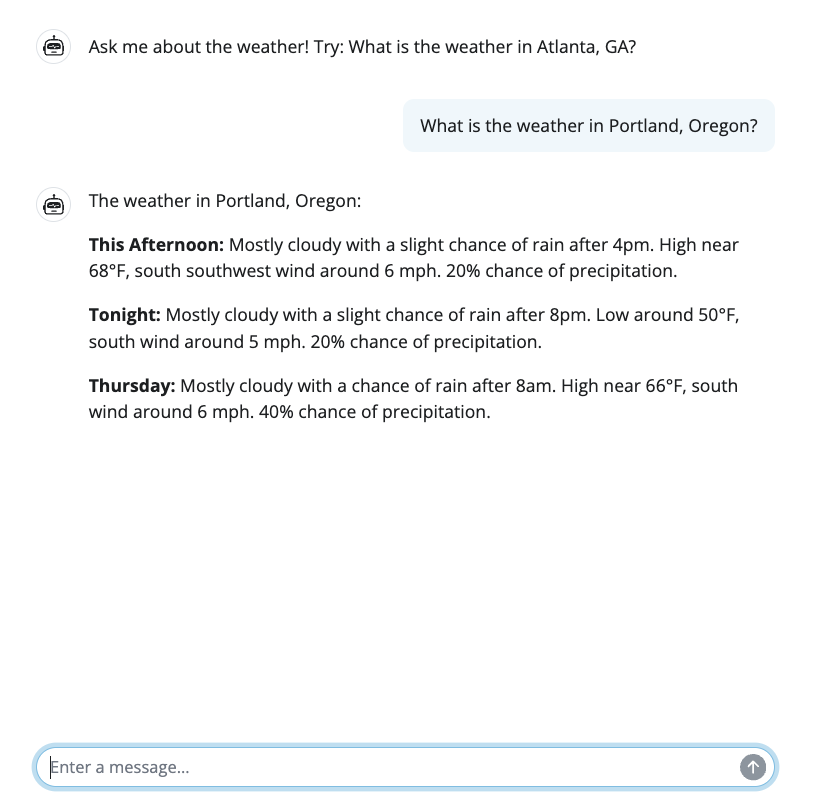
The images below show a Shiny app that uses Generative AI to provide weather forecasts, and an example trace in Logfire. The trace captures the entire user session, including reactive updates, model calls, and a tool invocation. We will explore this example in more detail later in the article.
Quick Start
Basic Configuration
You can use OTel with or without an observability backend (e.g. Logfire, Jaeger, Langfuse, etc.)
The standard way to enable OpenTelemetry is the opentelemetry-instrument wrapper (zero-code auto-instrumentation), which configures the SDK before your app starts — your app contains no instrumentation code at all. Installing shiny[otel] provides the OpenTelemetry SDK, the OTLP exporters, and the wrapper.
To simplify things, we’ll use Logfire as our example observability backend for configuration and screenshots throughout the rest of this tutorial.
All configuration lives in the launch command; your app contains no instrumentation code.
Setup
uv add "shiny[otel]"App — write your app as usual, with no OpenTelemetry code:
app.py
from shiny.express import input, render, ui

ui.input_slider("n", "N", 1, 100, 50)

@render.text
def result():
    return f"You selected: {input.n()}"
Run the app under the opentelemetry-instrument wrapper:
# Print spans to the console (local debugging, no backend needed)
uv run opentelemetry-instrument --traces_exporter console shiny run app.py

# Or export over OTLP (the default) to a local collector or backend
OTEL_SERVICE_NAME=my-shiny-app uv run opentelemetry-instrument shiny run app.py
Everything is configurable through standard OpenTelemetry environment variables or CLI flags. A few tips:
- Set
OTEL_SERVICE_NAME; otherwise traces reportservice.name: unknown_service. - Auto-instrumentation also instruments other libraries your app uses (HTTP clients, databases, etc.), so their spans appear alongside Shiny’s.
shiny run --reloadworks; the reloaded process inherits the instrumentation.
Logfire (Observability Backend Service)
Pydantic Logfire provides zero-configuration OpenTelemetry setup with a managed observability platform. You will need to set up a Logfire account and project.
Logfire is a standard OTLP backend, so opentelemetry-instrument can export to it with only environment variables and a write token:
export OTEL_SERVICE_NAME=my-shiny-app
export OTEL_EXPORTER_OTLP_PROTOCOL=http/protobuf  # Logfire speaks OTLP over HTTP, not gRPC
export OTEL_EXPORTER_OTLP_ENDPOINT="https://logfire-us.pydantic.dev"  # or logfire-eu
export OTEL_EXPORTER_OTLP_HEADERS="Authorization=$LOGFIRE_TOKEN"
uv run opentelemetry-instrument shiny run app.py
Alternatively, the logfire SDK manages OpenTelemetry itself (a code-based setup). On your first run of logfire, it will ask you to authenticate and choose which project your metrics will be associated with.
uv add logfire
uv run logfire authimport logfire
import os
# Connect your app to the logfire backend so it can receive traces
logfire.configure()
# Import Shiny and set collection level
from shiny import App, ui, render
os.environ["SHINY_OTEL_COLLECT"] = "reactivity"
# Use Shiny normally - tracing happens automatically
app_ui = ui.page_fluid(
ui.input_slider("n", "N", 1, 100, 50),
ui.output_text("result")
)
def server(input, output, session):
@render.text
def result():
return f"You selected: {input.n()}"
app = App(app_ui, server)View traces at logfire.pydantic.dev - you’ll see session spans, reactive updates, and individual reactive executions with SQL-queryable data.
See the Logfire documentation for more details on querying, alerts, and dashboards.
If you can’t control the launch command (or prefer explicit configuration), configure the SDK in your app code instead.
Setup
# Option 1: Install with Shiny's optional dependencies
uv add "shiny[otel]"

# Option 2: Install the SDK manually
uv add opentelemetry-sdk opentelemetry-exporter-otlp
Run the app directly — no wrapper:
uv run shiny run app.pyExtract setup logic into a configuration module
To keep your app efficient, move OpenTelemetry setup into a dedicated module that is imported before shiny is imported. This keeps your app files clean and ensures configuration (environment variables, Logfire, AI instrumentation) is applied consistently before Shiny imports.
Remember that OpenTelemetry should be configured in exactly one place: if you launch your app with opentelemetry-instrument, skip the configuration module — a tracer provider can only be installed once per process, and later in-code setup is ignored with a warning.
You’ll notice our otel_config module includes setting SHINY_OTEL_COLLECT. This variable controls how much detail is captured and defaults to "all".
You may want to reduce or refine your own collection level. Se the portion on collection levels for more information.
otel_config.py
import os

import logfire

# Set collection level for OpenTelemetry
os.environ["SHINY_OTEL_COLLECT"] = "reactivity"

# Set up AI provider credentials (e.g., AWS_PROFILE for AWS Bedrock)
if "AWS_PROFILE" not in os.environ:
    os.environ["AWS_PROFILE"] = "claude"

# Configure Logfire (or other observability backend)
logfire.configure()
Then in the main app.py file, import it before importing Shiny:
import otel_config  # runs configuration as a side effect

from shiny.express import ui, render
# ...OpenTelemetry supports both zero-code and code-based instrumentation. Prefer zero-code when you can: keeping configuration in the launch command lets each environment behave differently — a hosted deployment (e.g. Posit Connect) can export OTLP to its collector while your local run prints to the console — without changing the app.
Whichever you choose, configure OpenTelemetry in one place. A tracer provider can only be installed once per process, so a code-based call like trace.set_tracer_provider(...) running under opentelemetry-instrument logs Overriding of current TracerProvider is not allowed and is ignored.
OpenTelemetry in Action
Below is an example app with an {chatlas} tool to fetch realtime weather forecasts for a given latitude and longitude. This simple (yet non-trivial) app helps us showcase what sort of information {shiny} and {chatlas} can surface via OTel.
Gaining timing insights into applications that leverage Generative AI (GenAI) is critical to improving user experience. Without OpenTelemetry, if a user stated an app was slow, we would not be able to accurately determine if the slowness was due to the AI model request time, AI model streaming time, tool execution time, or even followup reactive calculations in Shiny.
import otel_config  # noqa: F401
import requests
from chatlas import ChatBedrockAnthropic
from opentelemetry.instrumentation.anthropic import AnthropicInstrumentor
from shiny.express import ui

AnthropicInstrumentor().instrument()


def get_weather_forecast(lat: float, lon: float) -> str:
    """
    Get the weather forecast for a location using the National Weather Service API.
    """
    headers = {"User-Agent": "ShinyWeatherApp"}

    points_response = requests.get(
        f"https://api.weather.gov/points/{lat},{lon}", headers=headers
    )
    points_response.raise_for_status()
    forecast_url = points_response.json()["properties"]["forecast"]

    forecast_response = requests.get(forecast_url, headers=headers)
    forecast_response.raise_for_status()
    periods = forecast_response.json()["properties"]["periods"][:3]

    return "\n\n".join(
        f"{period['name']}: {period['detailedForecast']}" for period in periods
    )


chat_client = ChatBedrockAnthropic(
    system_prompt="Be terse.", model="us.anthropic.claude-sonnet-4-5-20250929-v1:0"
)
chat_client.register_tool(get_weather_forecast)

ui.page_opts(fillable=True, fillable_mobile=True)

chat = ui.Chat(id="chat")
chat.ui(messages=["Ask me about the weather! Try: What is the weather in Atlanta, GA?"])


@chat.on_user_submit
async def handle_user_input(user_input: str):
    response = await chat_client.stream_async(user_input)
    await chat.append_message_stream(response)
You’ll notice that the app.py has no OpenTelemetry specific code within the app itself. We only need to set system environment variables and (optionally) add our AI provider’s instrumentation package.
In OpenTelemetry, a span represents a unit of work or operation within your application. Each span captures:
- The operation’s name and start/end time
- Attributes (metadata) about the operation
- The relationship to parent spans (forming a trace hierarchy)
Multiple spans form a trace, which shows the complete path of a request through your application. In Shiny, spans automatically track reactive computations, session lifecycle events, and user interactions, helping you understand the sequence and timing of operations.
Span Naming Example
Shiny automatically generates descriptive span names for all reactive computations based on their function names and type. You don’t need to manually instrument your code—just write your reactive functions as usual.
Span naming format: <type> [<modifiers> ][<namespace>:]<name>
For example:
@reactive.effect
@reactive.event(input.click)
def filtered_data():
    ...
    # Span name: "reactive.effect event filtered_data"
In the example apps above, the @chat.on_user_submit decorated function handle_user_input will appear in traces as "reactive.effect event handle_user_input".
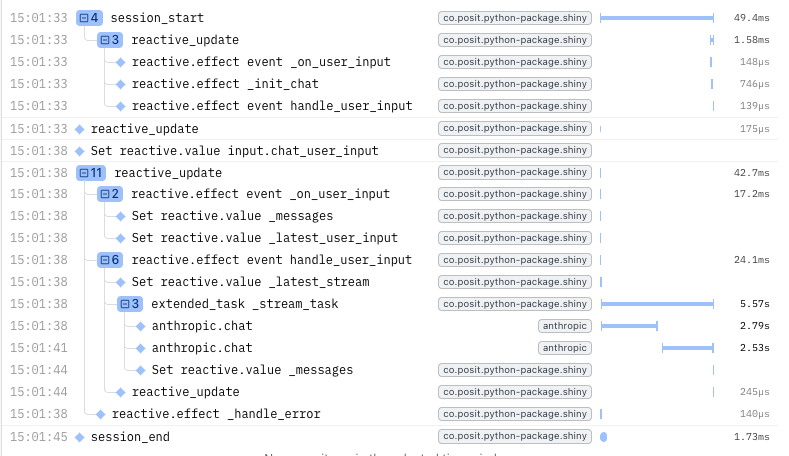
When you run the app and interact with it, OpenTelemetry traces are automatically recorded and sent to your configured backend (Logfire in this case). Here’s an example trace from Logfire showing a user session interacting with the chat app and the weather tool:
The traces above recorded a single user session where the user asked for the weather in Atlanta, GA and then closed the app. The trace shows:
- The Shiny session lifecycle, including
session_startandsession_end - Many
Set reactive.valuespans for handling user input. - Reactive updates triggered by changes in the
session’s input - An
ExtendedTaskspan for the computation of the AI agent response - 2x
anthropic.chatspans representing calls to the AI agent model - A single
get_weather_forecasttool call being executed
Notice how the spans are nested, showing the relationship between user actions, required reactive calculations, and external API calls. This level of detail helps you understand exactly how your app is performing in production and where any bottlenecks or issues may arise.
You can instrument your database calls and external API calls too! Services like logfire have methods designed to hook directly into your database of choice and provide meaningful information on slow or inefficient queries and operations.
See our DuckDB instrumentation example in the Advanced Usage section for a complete working example.
What can Shiny record?
Shiny automatically creates OpenTelemetry spans for:
- Session lifecycle: When sessions start and end, including HTTP request details
- Reactive updates: The entire cascade of reactive calculations triggered by an input change or a new output to be rendered
- Reactive expressions: Individual calculations such as
@reactive.calc,@reactive.effect,@render.*, and other reactive constructs
Additionally, Shiny adds logs for events such as:
- Fatal or unhandled errors (with optional error message sanitization)
- When a
reactive.value()is set
Every span and log entry provided by Shiny includes the session ID (session.id) attribute, making it easy to filter and analyze data for specific user sessions.
Collection Levels
Automatic tracing is perfect to get started, but you may want more control over what gets traced. Shiny gives you that flexibility through the SHINY_OTEL_COLLECT environment variable. You can set this to control the level of tracing detail with the following values:
"none"- No Shiny OpenTelemetry tracing"session"- Track session start and end"reactive_update"- Track reactive updates (includes"session"tracing)"reactivity"- Trace all reactive expressions (includes"reactive_update"tracing)"all"[Default] - Everything (currently equivalent to “reactivity”)
With "all" being the default level of tracing, you may want to reduce the amount of Shiny spans/logs collected for large applications or production environments. Reducing the amount of Shiny spans/logs collected can help decrease the volume of telemetry data being sent to your backend, reducing costs.
For example, we can set the SHINY_OTEL_COLLECT environment variable to "session" to only trace session start and session end events.
Custom Spans & Logs
If you are going to add your own spans or logs using OpenTelemetry, you may want to reduce the amount of Shiny spans collected to "reactive_update". This will create a span for every reactive update in addition to the session start/end spans. This level of tracing provides a high-level overview of user interactions without the noise of every individual reactive expression. Your custom spans/logs can then fill in the gaps for specific operations you care about.
Suppressing Spans & Security
You may want to remove spans/logs for specific parts of your app. For example, you may want to avoid logging certain sensitive data or avoid tracing certain reactive expressions or outputs that are not critical to your analysis. You can achieve this using the otel.suppress() decorator or context manager.
The collection level must be set when creating the reactive objects (like @reactive.calc, @reactive.effect, @render.*, etc.) to control tracing for those objects.
For example:
# Suppress telemetry for a specific reactive calc
@reactive.calc
@otel.suppress
def sensitive_data():
    return load_credentials()

# Or suppress telemetry for a group of reactive objects
with otel.suppress():
    # All reactive objects created in this block have telemetry disabled
    @reactive.calc
    def private_calc():
        return process_sensitive_data()

    @render.text
    def private_output():
        return private_calc()
Interpreting Traces
When looking at the trace for timing, you can see how long a model request took in the anthropic.chat spans.
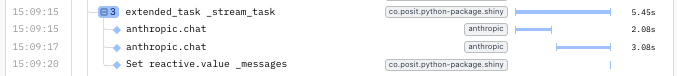
The gap between this span’s length and its parent’s length is how long the results took to stream back to the user or make a decision. For the overall user experience, the total time taken from input to output is represented by the extended_task_stream_task span, roughly 5.5 seconds in this case. Only around 2 seconds were spent in the tool call (something we as app authors could possibly optimize). The remaining ~3 seconds was spent in the model response generation and streaming.
More generally, as users interact with your app, Shiny generates traces that generally look like this:
(log) Set reactive.value input.<value_name>
reactive_update
└── output <output_name>
    └── reactive <reactive_name>
        └── reactive <inner_reactive_name>
This example implicitly shows a relationship between input <value_name> changing, and <output_name> being re-rendered as a result of that change.
It explicitly shows the chain of reactive expressions that were needed to be computed to produce the new value for <output_name>, including any nested reactives.
Understanding reactive dependencies
Traces reveal the dependency chain in your reactive graph. When an input changes, you can see:
- Which reactive expressions were invalidated
- The order in which they re-executed
- How long each computation took
- Which outputs were ultimately updated
This visibility is invaluable for identifying performance bottlenecks and understanding unexpected reactive behavior.
Types of Traces & Spans
Shiny’s OpenTelemetry integration automatically creates spans for key operations within your application.
Session lifecycle
Shiny traces the session lifecycle when the collect level is "session" or higher.
A session starts when a user opens your Shiny app in their browser. Each session keeps its own state (input values, reactive values, outputs, etc.). A session ends when the user navigates away, closes the window, or the connection is lost.
If you have multiple users at once, they will each have their own session. This is where our logged session_ids can be helpful to distinguish the events of an individual session, even if multiple sessions are happening concurrently.
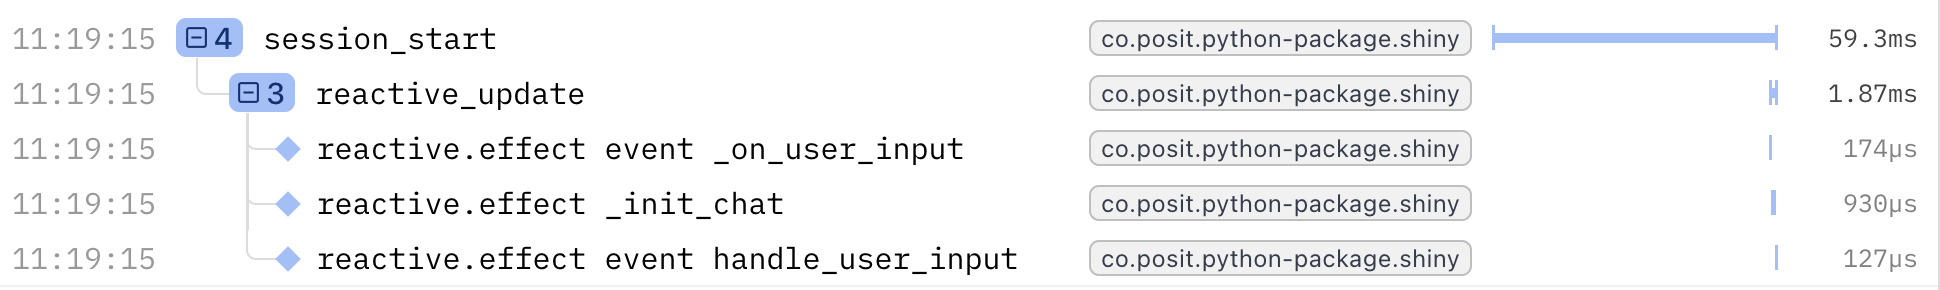
Every Shiny session generates a span marking when each session starts and ends: session_start and session_end. The session_start span will capture the execution of your app’s server function, including any initial reactive_update spans (if enabled) that run when the session begins.
Spans
session_start: When starting a new sessionsession_end: When ending the session
Reactive updates
Shiny traces reactive updates when the collect level is "reactive_update" or higher.
When an input changes or an output needs to be re-rendered, Shiny creates a reactive_update span that encompasses the entire cascade of reactive calculations triggered by that change.
The reactive_update span starts when Shiny starts an output render or @reactive.effect calculation. The reactive_update span ends when all reactive expressions have resolved.
The time elapsed in the reactive_update span is equivalent to the time the Python thread is busy (as every session of the Shiny app is single threaded).
Within a reactive_update span, new input values will not be processed. That is, if a user changes a value, the server will not process these new changes until after the current reactive update completes.
For the best performance available, use ExtendedTask for long-running computations. Extended tasks run asynchronously outside the reactive graph, allowing your app to remain responsive to user interactions while the task executes. Once the task completes, it reports its result back to the reactive system.
For example, you might have the user input certain variables, then kick off an extended task that performs a model training, testing, and prediction process. The user will be able to continue looking around your app, and your output (ex. graphs, charts) will update when the extended task (model training & testing) completes. Learn more about nonblocking behavior and extended tasks.
Spans
reactive_update: The entire cascade of reactive calculations triggered by an input change or a new output to be rendered
Reactive expressions
Shiny traces the execution of every reactive calculation when the collect level is "reactivity" or higher.
All "reactivity" spans have an optional module id prefix <mod_id>: if the reactive object is defined within a module. This prefix will automatically appear. Having the module id within the span name helps disambiguate reactives with the same name across different modules.
The span names for reactive.calc, reactive.effect, and output render functions may include quantifiers such as event (for event-driven reactives).
For example, an event-driven reactive.effect() within a module would have a span name like reactive.effect event myModuleId:my_effect, defined as:
@reactive.effect
@reactive.event(input.trigger)
def my_effect():
    ...
Spans
reactive.calc [event ][<mod_id>:]<name>: Reactive calculations created with@reactive.calc. Calculate a new value only when their upstream values change.reactive.effect [event ][<mod_id>:]<name>: Side effects created with@reactive.effect. Perform actions in response to reactive changes.output [event ][<mod_id>:]<name>: Output rendering created with@render.*decorators (e.g.,@render.text,@render.plot).reactive.poll [<mod_id>:]<name>: Reactive polling created withreactive.poll(). Periodically checks for changes.reactive.file_reader [<mod_id>:]<name>: File monitoring created withreactive.file_reader(). Re-reads files when they change.extended_task [<mod_id>:]<name>: Long-running background computations created with@ui.taskorui.ExtendedTask.
Labels
Each OTel span has its label derived from the function name. It is highly recommended to use descriptive function names for your reactive expressions and effects to make traces easier to interpret.
In Python, span labels are automatically extracted from the function’s __name__ attribute. Functions without meaningful names (lambdas, functions named _, etc.) will be labeled as <anonymous>:
# ❌ - span label: `"reactive.calc <anonymous>"`
x = reactive.calc(lambda: ...)

# ❌ - span label: `"reactive.effect <anonymous>"`
@reactive.effect
def _():  # Single underscore = anonymous
    ...
For better trace readability, use descriptive function names:
# ✅ - span label: `"reactive.calc chat_last_message"`
@reactive.calc
def chat_last_message():
    return chat.messages()[-1]

# ✅ - span label: `"reactive.effect update_user_input"`
@reactive.effect
@reactive.event(input.submit)
def update_user_input():
    # Process user input...
    pass

# ✅ - span label: `"extended_task weather_forecast_task"`
@ui.task
async def weather_forecast_task():
    return await fetch_weather(lat, lon)
Logged events
In addition to OTel spans, Shiny logs important events:
- Fatal errors:
Fatal error(fatallevel) - Unhandled errors:
Unhandled error(errorlevel) reactive.value()values being set:Set reactive.value [<mod_id>:]<name>(infolevel)- Extended task invocations being queued:
extended_task queued [<mod_id>:]<name>(debuglevel)
The reactive value and extended task logs require that the Shiny OTel collect level be set to "reactivity" or higher.
All spans and log entries include the session ID, making it easy to filter and analyze data for specific user sessions.
Production Considerations
When deploying Shiny apps with OpenTelemetry to production, consider these best practices:
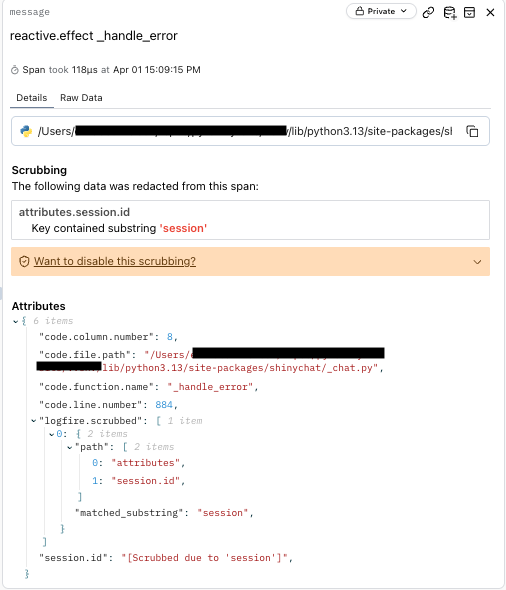
Sanitize sensitive data
Shiny automatically sanitizes exception messages in OpenTelemetry spans by default. However, this only protects sensitive data in error messages. Sensitive data can still leak through other channels.
What gets sanitized automatically
By default (App.sanitize_otel_errors=True), Shiny replaces exception messages with a generic message:
# Original exception in your code:
raise ValueError("Database password is 'secret123'")

# What gets recorded in OpenTelemetry:
Exception("An error has occurred. Check your logs or contact the app author for clarification.")
Error sanitization is controlled separately for UI display and OpenTelemetry:
App.sanitize_errors: Controls error messages shown in the UI (default:Truein production)App.sanitize_otel_errors: Controls exception messages in OpenTelemetry spans (default:True)
What does NOT get sanitized automatically
Exception sanitization does not protect:
- Reactive value logs: When
reactive.value().set()is called, the actual value is logged (atinfolevel whenSHINY_OTEL_COLLECT=reactivity) - Span attributes: Source file paths, function names, session IDs
- Stack traces: Variable values visible in exception tracebacks
- Custom attributes: Any attributes you manually add to spans
Important: Exception message sanitization alone is insufficient for securing sensitive operations. Use @otel.suppress for complete protection.
Control telemetry collection for sensitive operations
Use @otel.suppress to exclude sensitive code from telemetry entirely:
from shiny import otel, reactive

# Exclude sensitive reactive calculations
@reactive.calc
@otel.suppress
def api_key_rotation():
    # No spans or logs generated for this function
    return rotate_api_keys()

# Or use as context manager during initialization
with otel.suppress():
    sensitive_data = reactive.value(fetch_secrets())
This is more secure than sanitization alone, as it prevents any Shiny telemetry collection for the wrapped code. Note, custom spans / non-Shiny spans will never be suppressed, only Shiny’s telemetry.
Set appropriate collection levels
Use environment variables to control telemetry granularity:
# Production: Minimize overhead, focus on session-level patterns
export SHINY_OTEL_COLLECT=session

# Staging: Include reactive updates for debugging
export SHINY_OTEL_COLLECT=reactive_update

# Development: Full instrumentation
export SHINY_OTEL_COLLECT=reactivity
Lower collection levels reduce performance overhead and data volume in production.
Correlate with other metrics
OpenTelemetry traces work best when combined with other observability data:
- Server metrics (CPU, memory, network)
- Application logs
- Custom business metrics
- Database query performance
This holistic view helps you understand not just what is slow, but why. The Otel ecosystem can also be helpful here.
Many observability platforms like Logfire provide integrated dashboards combining traces, logs, and metrics for a holistic view of your application’s health.
Advanced Usage
After adding OTel to your application, you may find that there are some areas of functionality where you want more information and others where you want less information. For example, you may want more information on particular reactive calculation, but less information on user-input updates before submission.
We’ll cover different strategies for adding and subtracting information below.
Custom Spans
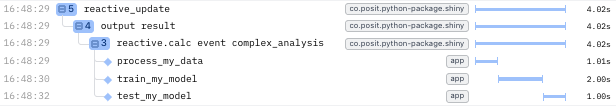
While Shiny automatically traces session and reactive execution, you may want to add custom spans for specific business logic or operations. These will use appear as children of Shiny’s automatic spans in your trace view.
You can use the standard OpenTelemetry API to create your own custom spans like so:
import time

import logfire
from opentelemetry import trace
from shiny import App, reactive, render, ui

def server(input, output, session):
    # Get tracer inside server function after Logfire is configured
    tracer = trace.get_tracer(__name__)

    @reactive.calc
    @reactive.event(input.run)
    def complex_analysis():
        iterations = input.iterations()

        with tracer.start_as_current_span("process_my_data"):
            # Simulate data preprocessing
            time.sleep(1)

        with tracer.start_as_current_span("train_my_model"):
            # Simulate data preprocessing
            time.sleep(2)

        with tracer.start_as_current_span("test_my_model"):
            # Simulate data preprocessing
            time.sleep(1)

return f"Completed {iterations} iterations in 3 seconds"This example uses otel.suppress(), custom spans, and custom attributes.
import os
import sys

sys.path.insert(0, os.path.dirname(__file__))
import time

import otel_config  # noqa: F401
from opentelemetry import trace
from shiny import otel, reactive
from shiny.express import input, render, ui

tracer = trace.get_tracer(__name__)

ui.page_opts(title="My App", fillable=True)

ui.input_slider("n", "N", 0, 100, 20)

with otel.suppress():

    @reactive.calc
    def expensive_calculation():
        with tracer.start_as_current_span("my custom span") as span:
            span.set_attribute("step", "expensive_step")
            time.sleep(2)
            return input.n() ** 2


@render.text
def n_squared():
    n_squared_val = expensive_calculation()
    return f"n * 2 = {n_squared_val}"
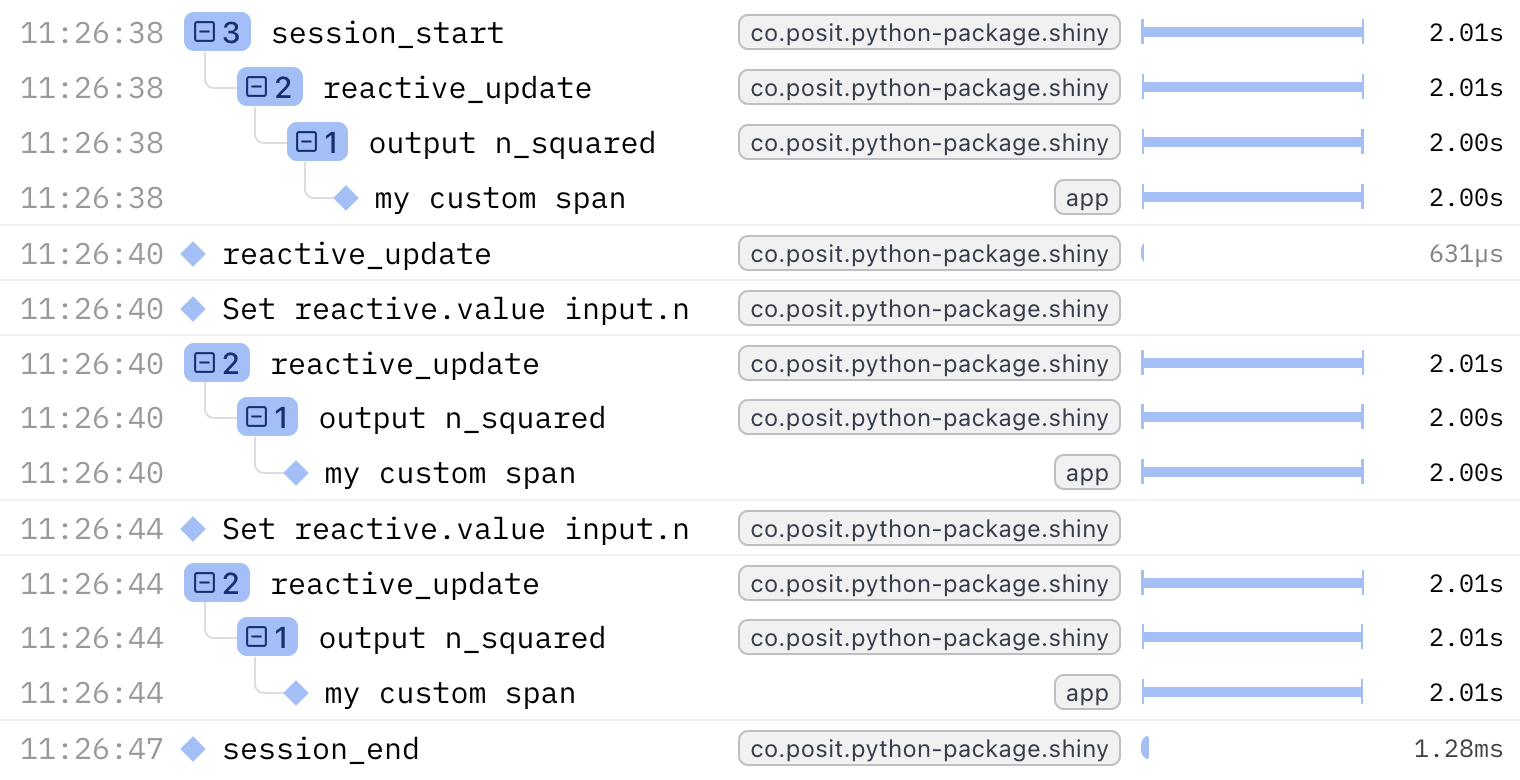
Suppressing Clutter
You might find that some of Shiny’s automatic tracing, while useful for debugging, can lead to clutter. To avoid tracing the intermediate reactive expressions (such as reactive.calc expensive_calculation), you can use with otel.suppress() to disable Shiny OTel spans/logs within that block.
For example, this app (without anything suppressed)
    @reactive.calc
    def expensive_calculation():
        # Start a custom span for this calculation
        with tracer.start_as_current_span("my custom span"):
            # Simulate an expensive operation
            time.sleep(2)

            return input.n() ** 2
becomes
    # Do not trace _Shiny_ reactive expressions within this block
    # All other otel spans/logs will still be recorded
    with otel.suppress():
        @reactive.calc
        def expensive_calculation():
            # Start a custom span for this calculation
            with tracer.start_as_current_span("my custom span"):
                # Simulate an expensive operation
                time.sleep(2)

                return input.n() ** 2
or
@reactive.calc
@otel.suppress
def expensive_calculation():
# Start a custom span for this calculation
with tracer.start_as_current_span("my custom span"):
# Simulate an expensive operation
time.sleep(2)
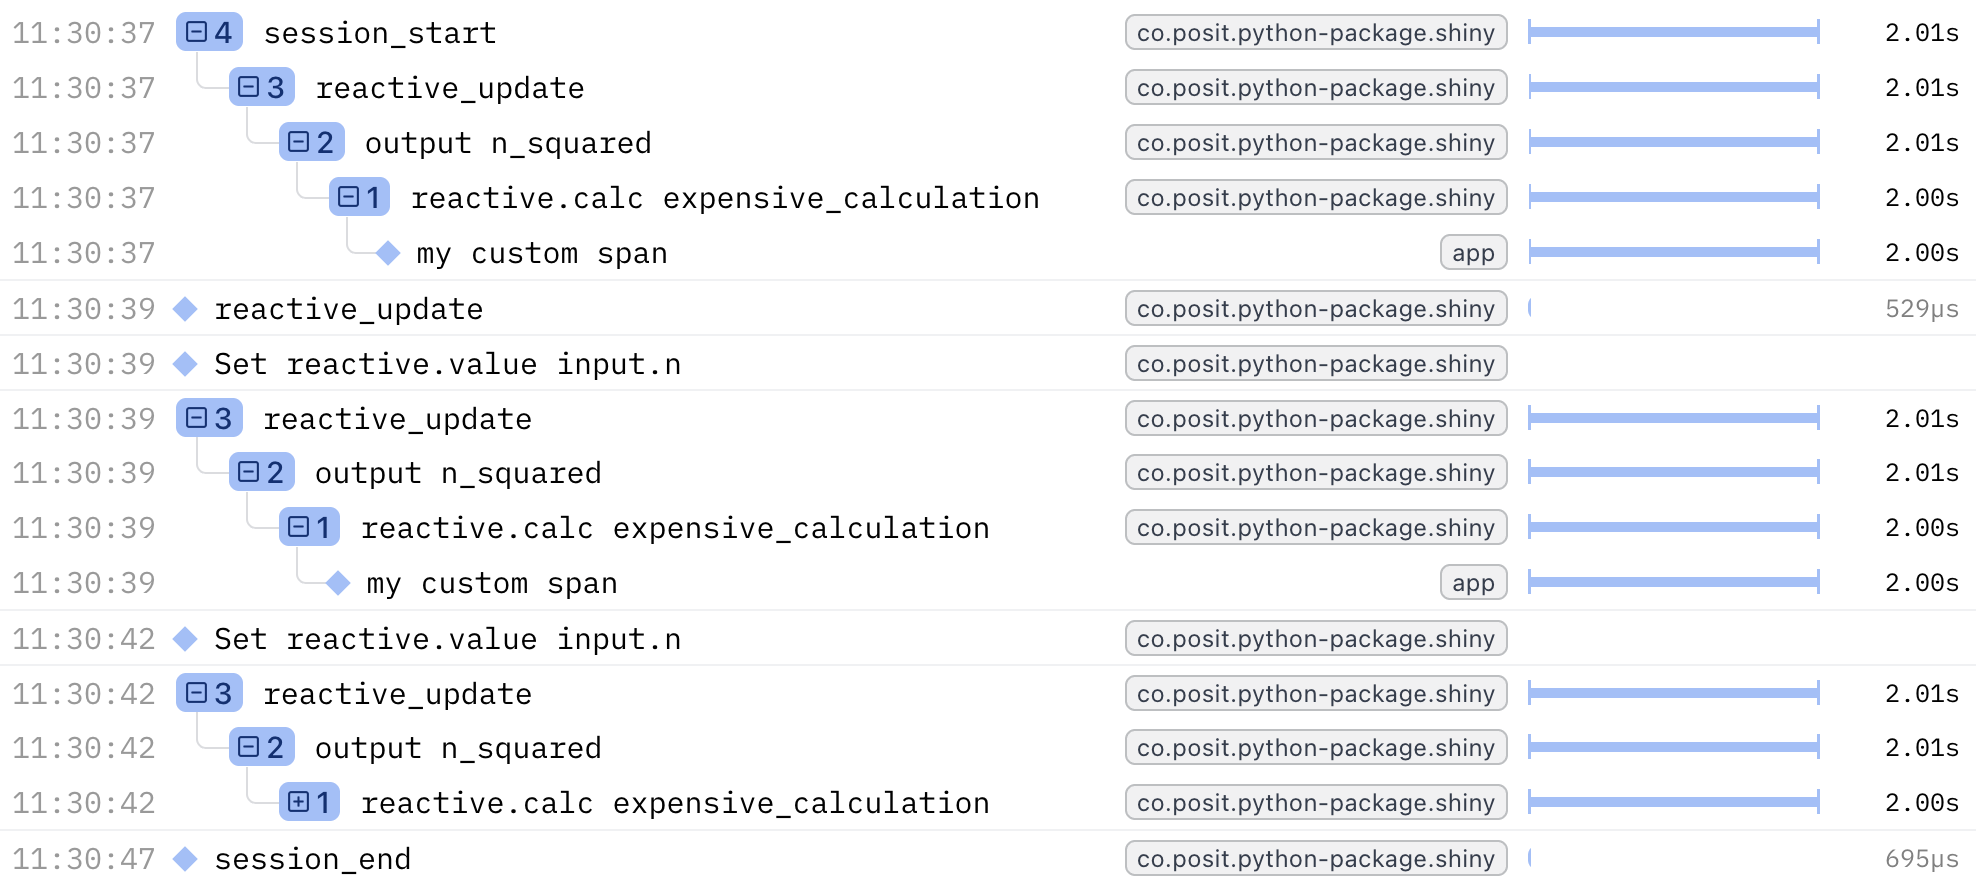
return input.n() ** 2Now your custom span will appear in the trace without the intermediate Shiny reactive spans cluttering the view.
Example:
Integrating with Third-Party Instrumentation
Many Python libraries have OpenTelemetry instrumentation available. These integrate seamlessly with Shiny’s tracing, giving you end-to-end visibility.
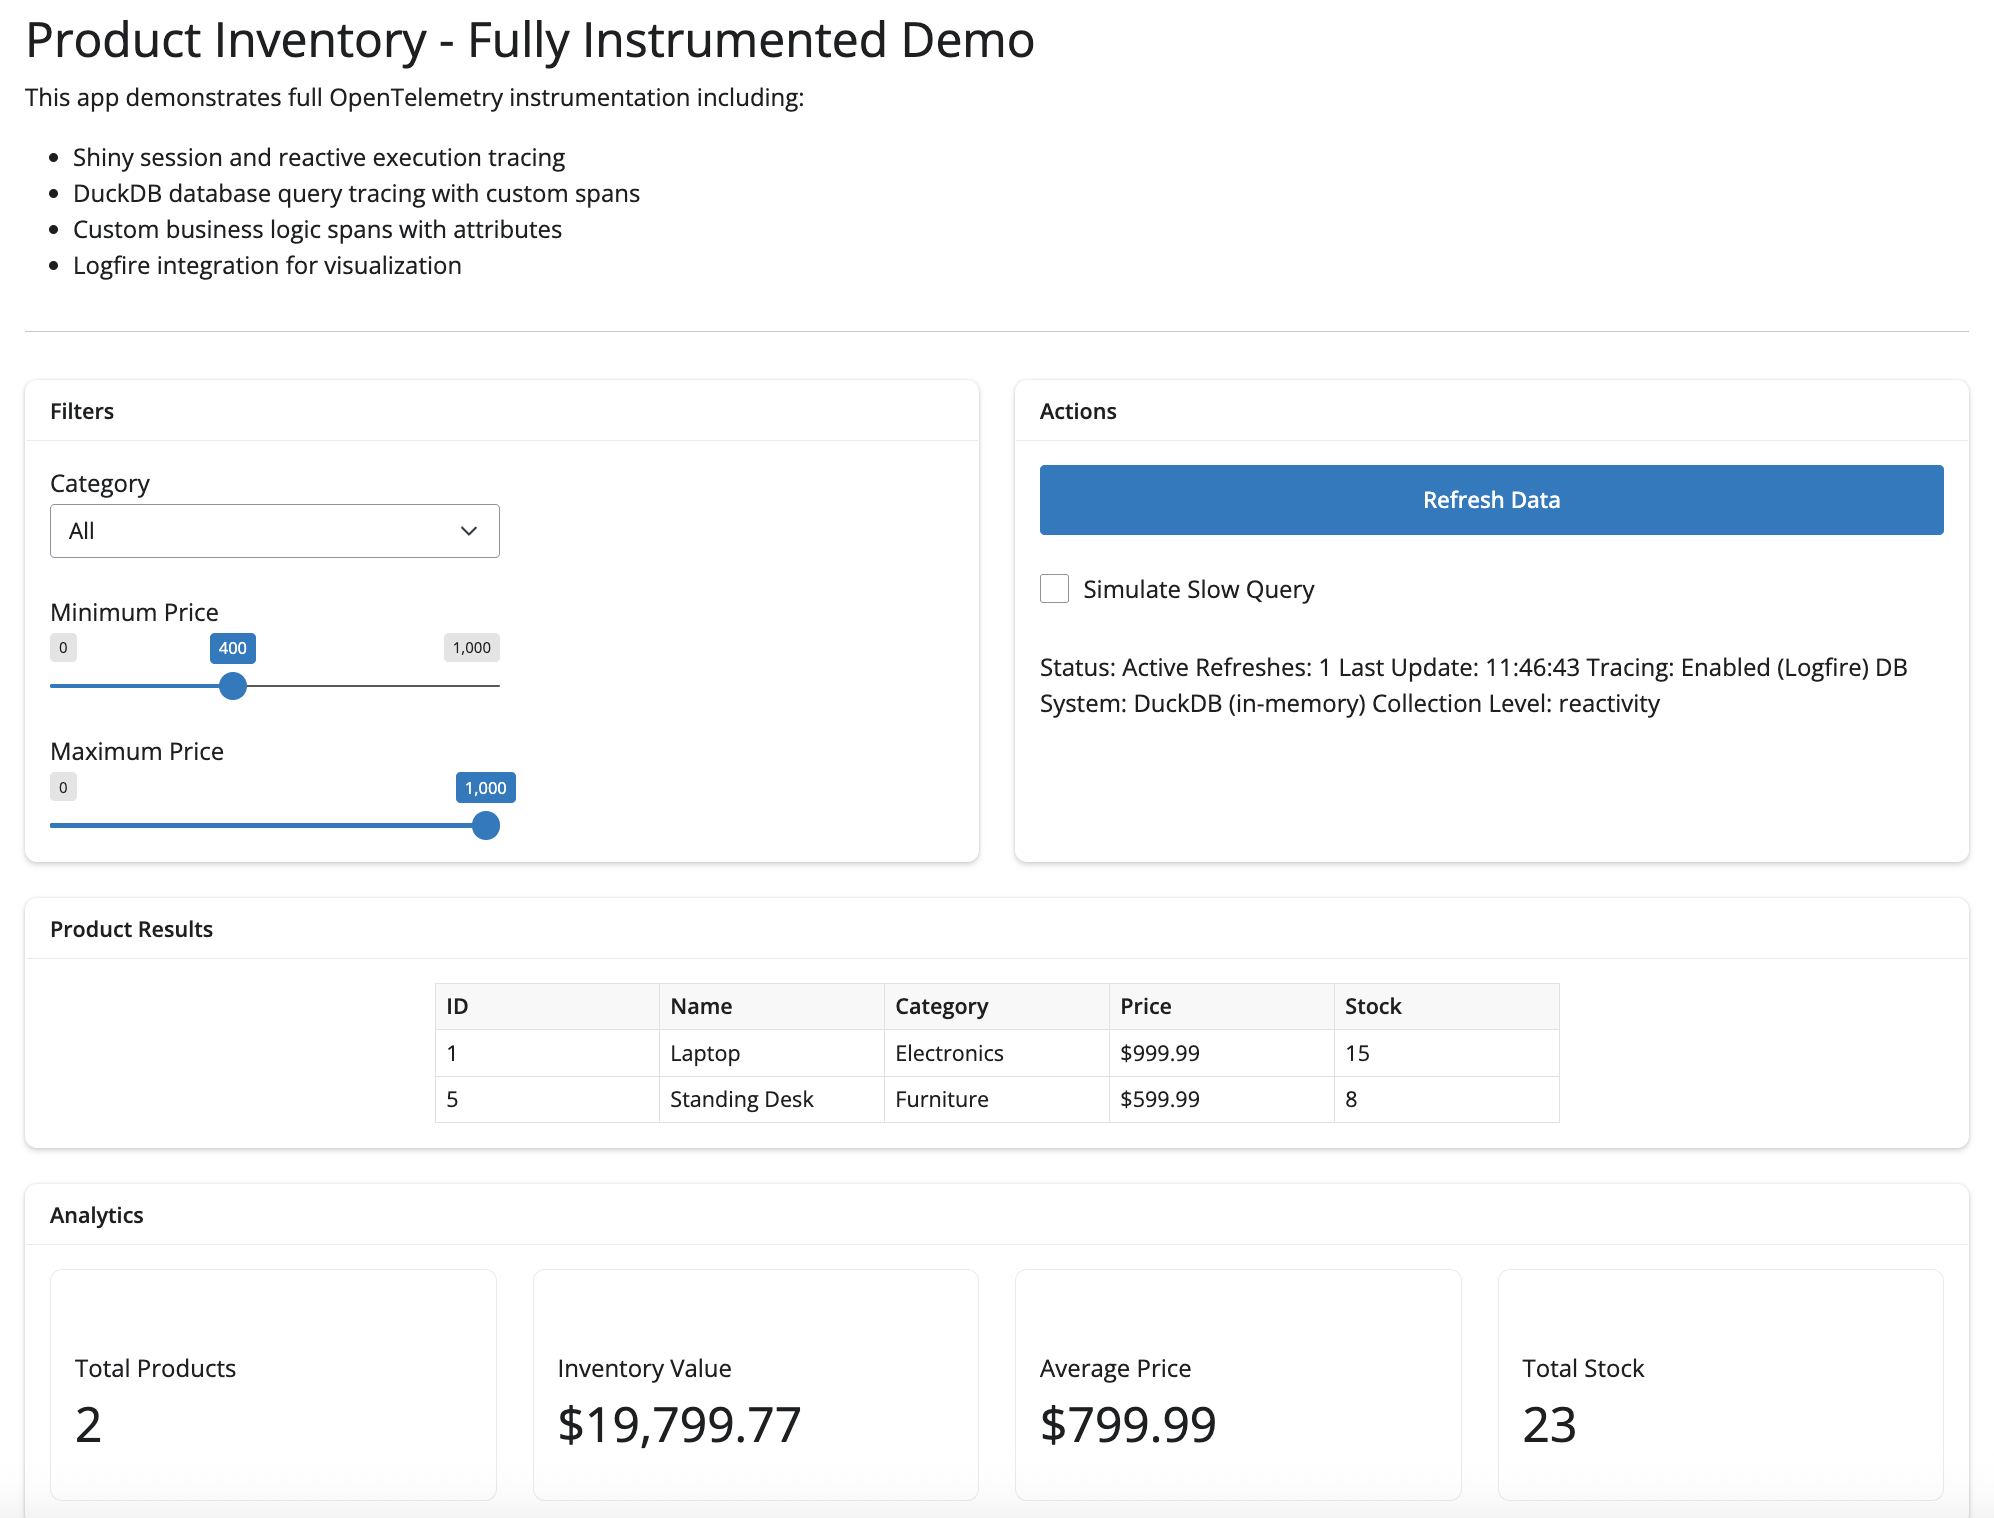
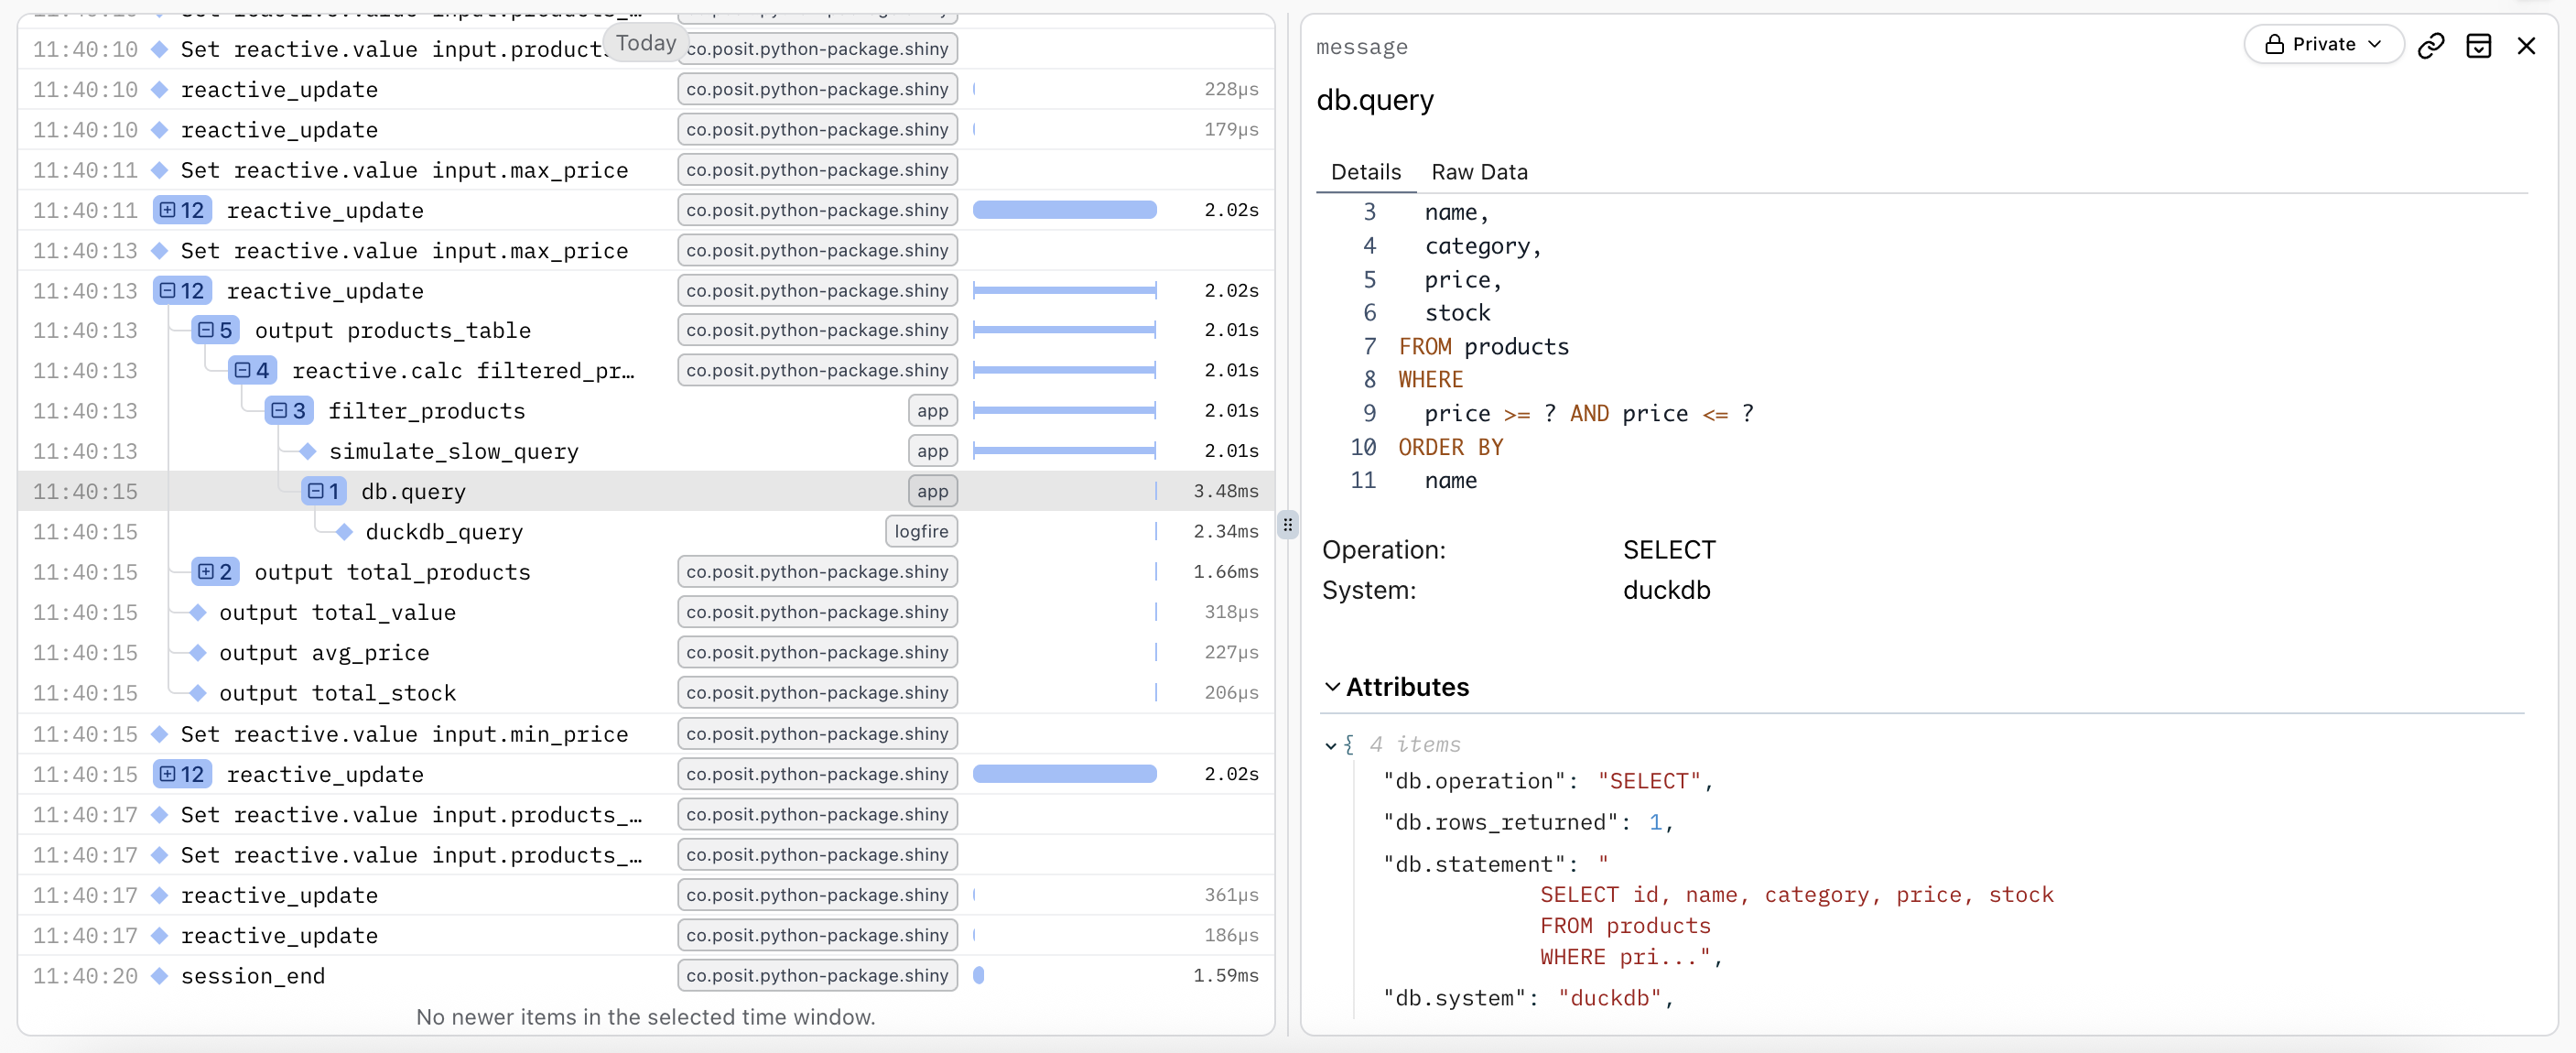
Database Example: DuckDB
Using Logfire’s DuckDB instrumentation, you can automatically trace all database queries with detailed span attributes including the query text, affected rows, and execution time.
# Fully instrumented Shiny app with DuckDB database calls.
#
# This example demonstrates:
# 1. Shiny's built-in OpenTelemetry tracing for reactive execution
# 2. Logfire for easy OpenTelemetry setup and visualization
# 3. Custom spans for database queries
# 4. Span attributes for better observability
#
# Requirements:
#     pip install shiny logfire duckdb pandas

import os
import sys
import time
from datetime import datetime

sys.path.insert(0, os.path.dirname(__file__))
import duckdb
import logfire
import otel_config  # noqa: F401
from opentelemetry import trace
from shiny import reactive
from shiny.express import input, render, ui

tracer = trace.get_tracer(__name__)


def init_database():
    """Initialize DuckDB database with sample products"""
    with tracer.start_as_current_span("init_database") as span:
        conn = duckdb.connect(":memory:")

        conn.execute("""
            CREATE TABLE products (
                id INTEGER PRIMARY KEY,
                name VARCHAR(100) NOT NULL,
                category VARCHAR(50) NOT NULL,
                price DECIMAL(10, 2) NOT NULL,
                stock INTEGER NOT NULL
            )
        """)

        products = [
            (1, "Laptop", "Electronics", 999.99, 15),
            (2, "Mouse", "Electronics", 29.99, 50),
            (3, "Keyboard", "Electronics", 79.99, 30),
            (4, "Desk Chair", "Furniture", 299.99, 10),
            (5, "Standing Desk", "Furniture", 599.99, 8),
            (6, "Monitor", "Electronics", 349.99, 20),
            (7, "Webcam", "Electronics", 89.99, 25),
            (8, "Bookshelf", "Furniture", 149.99, 12),
        ]

        conn.executemany("INSERT INTO products VALUES (?, ?, ?, ?, ?)", products)

        span.set_attribute("products.count", len(products))
        span.set_attribute("db.system", "duckdb")
        span.set_attribute("db.type", "in-memory")

        return conn


db_conn = init_database()

refresh_count = reactive.value(0)

ui.page_opts(title="Product Inventory - Fully Instrumented Demo")

ui.markdown(
    """
    This app demonstrates full OpenTelemetry instrumentation including:
    - Shiny session and reactive execution tracing
    - DuckDB database query tracing with custom spans
    - Custom business logic spans with attributes
    - Logfire integration for visualization
    """
)
ui.hr()


@reactive.calc
@reactive.event(input.refresh)
def increment_refresh():
    count = refresh_count() + 1
    refresh_count.set(count)
    return count


@reactive.calc
def filtered_products():
    increment_refresh()

    with tracer.start_as_current_span("filter_products") as span:
        span.set_attribute("filter.category", input.category())
        span.set_attribute("filter.min_price", input.min_price())
        span.set_attribute("filter.max_price", input.max_price())
        span.set_attribute("filter.slow_query", input.slow_query())
        span.set_attribute("db.system", "duckdb")

        if input.slow_query():
            with tracer.start_as_current_span("simulate_slow_query") as slow_span:
                slow_span.set_attribute("sleep.duration", 2.0)
                time.sleep(2)

        query = """
            SELECT id, name, category, price, stock
            FROM products
            WHERE price >= ? AND price <= ?
        """
        params = [input.min_price(), input.max_price()]

        if input.category() != "All":
            query += " AND category = ?"
            params.append(input.category())

        query += " ORDER BY name"

        with tracer.start_as_current_span("db.query") as db_span:
            db_span.set_attribute("db.system", "duckdb")
            db_span.set_attribute("db.statement", query)
            db_span.set_attribute("db.operation", "SELECT")

            with logfire.span("duckdb_query", query=query, params=params):
                result = db_conn.execute(query, params).fetchall()

            db_span.set_attribute("db.rows_returned", len(result))

        span.set_attribute("results.count", len(result))

        return result


@reactive.calc
def calculate_analytics():
    products = filtered_products()

    with tracer.start_as_current_span("calculate_analytics") as span:
        if not products:
            span.set_attribute("analytics.empty", True)
            return {
                "total_products": 0,
                "total_value": 0,
                "avg_price": 0,
                "total_stock": 0,
            }

        total_value = sum(p[3] * p[4] for p in products)
        avg_price = sum(p[3] for p in products) / len(products)
        total_stock = sum(p[4] for p in products)

        analytics = {
            "total_products": len(products),
            "total_value": total_value,
            "avg_price": avg_price,
            "total_stock": total_stock,
        }

        span.set_attribute("analytics.total_products", analytics["total_products"])
        span.set_attribute("analytics.total_value", analytics["total_value"])
        span.set_attribute("analytics.avg_price", analytics["avg_price"])
        span.set_attribute("analytics.total_stock", analytics["total_stock"])

        return analytics


with ui.layout_columns():
    with ui.card():
        ui.card_header("Filters")
        ui.input_select(
            "category",
            "Category",
            choices=["All", "Electronics", "Furniture"],
            selected="All",
        )
        ui.input_slider("min_price", "Minimum Price", 0, 1000, 0, step=50)
        ui.input_slider("max_price", "Maximum Price", 0, 1000, 1000, step=50)

    with ui.card():
        ui.card_header("Actions")
        ui.input_action_button("refresh", "Refresh Data", class_="btn-primary")
        ui.input_checkbox("slow_query", "Simulate Slow Query", value=False)

        @render.text
        def status():
            count = refresh_count()
            timestamp = datetime.now().strftime("%H:%M:%S")

            with tracer.start_as_current_span("render_status") as span:
                span.set_attribute("refresh.count", count)
                span.set_attribute("render.timestamp", timestamp)

                return f"""
Status: Active
Refreshes: {count}
Last Update: {timestamp}
Tracing: Enabled (Logfire)
DB System: DuckDB (in-memory)
Collection Level: {os.environ.get("SHINY_OTEL_COLLECT", "default")}
                """.strip()


with ui.card():
    ui.card_header("Product Results")

    @render.data_frame
    def products_table():
        import pandas as pd

        products = filtered_products()

        if not products:
            return pd.DataFrame(
                {"Message": ["No products found matching your criteria"]}
            )

        return pd.DataFrame(
            {
                "ID": [p[0] for p in products],
                "Name": [p[1] for p in products],
                "Category": [p[2] for p in products],
                "Price": [f"${p[3]:.2f}" for p in products],
                "Stock": [p[4] for p in products],
            }
        )


with ui.card():
    ui.card_header("Analytics")

    with ui.layout_columns():
        with ui.value_box(showcase=ui.tags.i(class_="fa-solid fa-boxes-stacked")):
            "Total Products"

            @render.text
            def total_products():
                return str(calculate_analytics()["total_products"])

        with ui.value_box(showcase=ui.tags.i(class_="fa-solid fa-dollar-sign")):
            "Inventory Value"

            @render.text
            def total_value():
                return f"${calculate_analytics()['total_value']:,.2f}"

        with ui.value_box(showcase=ui.tags.i(class_="fa-solid fa-chart-line")):
            "Average Price"

            @render.text
            def avg_price():
                return f"${calculate_analytics()['avg_price']:.2f}"

        with ui.value_box(showcase=ui.tags.i(class_="fa-solid fa-warehouse")):
            "Total Stock"

            @render.text
            def total_stock():
                return str(calculate_analytics()["total_stock"])
AI Example: Anthropic
Using opentelemetry-instrumentation-anthropic, you get automatic traces for all AI model calls, including token usage, model name, and response streaming details.
import otel_config  # noqa: F401
import requests
from chatlas import ChatBedrockAnthropic
from opentelemetry.instrumentation.anthropic import AnthropicInstrumentor
from shiny.express import ui

AnthropicInstrumentor().instrument()


def get_weather_forecast(lat: float, lon: float) -> str:
    """
    Get the weather forecast for a location using the National Weather Service API.
    """
    headers = {"User-Agent": "ShinyWeatherApp"}

    points_response = requests.get(
        f"https://api.weather.gov/points/{lat},{lon}", headers=headers
    )
    points_response.raise_for_status()
    forecast_url = points_response.json()["properties"]["forecast"]

    forecast_response = requests.get(forecast_url, headers=headers)
    forecast_response.raise_for_status()
    periods = forecast_response.json()["properties"]["periods"][:3]

    return "\n\n".join(
        f"{period['name']}: {period['detailedForecast']}" for period in periods
    )


chat_client = ChatBedrockAnthropic(
    system_prompt="Be terse.", model="us.anthropic.claude-sonnet-4-5-20250929-v1:0"
)
chat_client.register_tool(get_weather_forecast)

ui.page_opts(fillable=True, fillable_mobile=True)

chat = ui.Chat(id="chat")
chat.ui(messages=["Ask me about the weather! Try: What is the weather in Atlanta, GA?"])


@chat.on_user_submit
async def handle_user_input(user_input: str):
    response = await chat_client.stream_async(user_input)
    await chat.append_message_stream(response)
Attributes
Existing attributes
Shiny automatically adds a session.id attribute to every span or log recorded. This session.id is a unique identifier for the Shiny session (equivalent to session.id in Python), allowing you to filter and analyze all telemetry data for a specific user session.
In addition to the session.id, Shiny automatically adds code attributes to reactive expression spans (reactive calcs, effects, extended tasks, and outputs).
With the combination of code.filepath, code.lineno, and code.column.number attributes, OpenTelemetry viewers can provide you a file path to copy into your IDE to take you directly to your code’s origin.
Adding Custom Attributes
You can enhance existing spans with custom attributes or add custom attributes to your own custom spans.
Using an existing span:
@reactive.calc
@reactive.event(input.run)
def complex_analysis():
    iterations = input.iterations()
    span = trace.get_current_span()
    span.set_attribute("iterations", iterations)

    # Simulate waiting for a function
    time.sleep(1)

    return f"Completed {iterations} iterations in 3 seconds"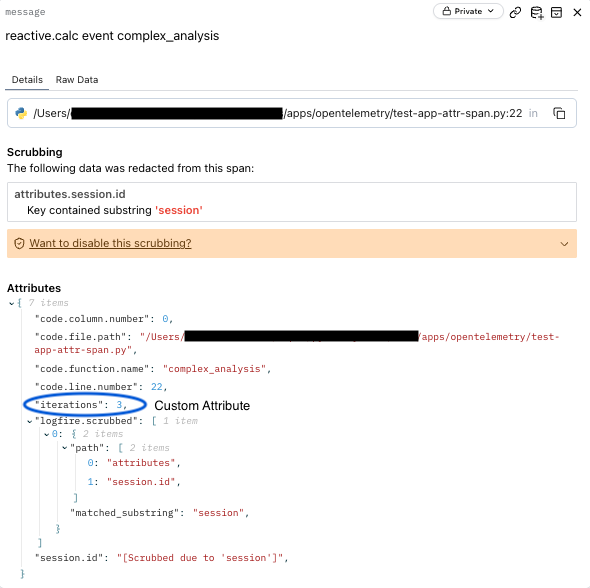
Using a custom span:
@reactive.calc
@reactive.event(input.run)
def complex_analysis():
    iterations = input.iterations()

    with tracer.start_as_current_span("process_my_data") as span:
        span.set_attribute("iterations", iterations)
        span.set_attribute("step", "preprocessing")
        time.sleep(1)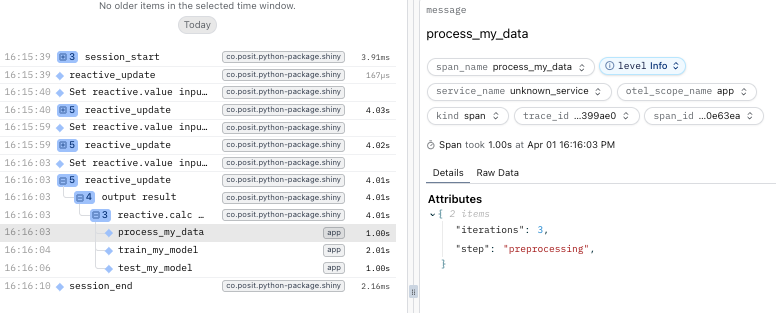
These attributes can be queried in your observability backend to filter and analyze traces.
Analyzing traces
While viewing traces in your observability platform’s UI is helpful for real-time debugging, you may want to download and analyze trace data programmatically for deeper analysis, reporting, or custom visualizations. The Logfire API provides a SQL-like query interface for retrieving traces and spans.
Querying traces
In the example below, we use Logfire’s API Logfire API to filter and retrieve traces for analysis.
conn = logfire.db_api.connect(read_token=read_token)

# Get all spans from a specific session
session_id = "bde80eac18e14ff4206f6503d9e3a0c7b3c5f05d7dede122c0012bde986d2b87"
query = f"SELECT * FROM RECORDS WHERE attributes->>'session.id' = '{session_id}'"

print(f"Spans for session {session_id}:")
df = pd.read_sql(query, conn)
print(df)
conn.close()The LOGFIRE_API_READ_TOKEN environment variable should contain a your Logfire read token. A Logfire API read token is different from a write token used for exporting traces.
You can generate read tokens in your Logfire project settings.
With this approach, you can programmatically retrieve and analyze trace data for your Shiny applications. You can extend this example to:
- Filter spans by session ID, span name, or any other attribute
- Calculate custom metrics like total session duration or slowest operations
- Create custom visualizations or reports
- Export data for further analysis in other tools
Common queries
The Logfire website only allows you to filter existing records (SELECT * from RECORDS WHERE ...).
Here are some useful queries for analyzing your Shiny app’s traces that leverage the full power of their SQL submitted through the API:
The Logfire API uses PostgreSQL syntax for queries. You can use standard SQL operations including WHERE, JOIN, GROUP BY, ORDER BY, and aggregate functions. The attributes column is a JSONB type, allowing you to query nested attributes using the ->> operator.
import os

import logfire.db_api
import pandas as pd
from dotenv import load_dotenv

# Load environment variables from .env file
load_dotenv()

# Get Logfire API read token from environment
read_token = os.getenv("LOGFIRE_READ_TOKEN")
if not read_token:
    raise ValueError("LOGFIRE_READ_TOKEN not found in environment variables")

conn = logfire.db_api.connect(read_token=read_token)

# Get all spans from a specific session
session_id = "bde80eac18e14ff4206f6503d9e3a0c7b3c5f05d7dede122c0012bde986d2b87"
query = f"SELECT * FROM RECORDS WHERE attributes->>'session.id' = '{session_id}'"

print(f"Spans for session {session_id}:")
df = pd.read_sql(query, conn)
print(df)

# We can also get aggregated data, e.g. number of sessions per hour
query = """
    SELECT date_trunc('hour', start_timestamp) as hour,
         COUNT(DISTINCT attributes->>'session.id') as session_count
  FROM records
  WHERE span_name = 'session.start'
  GROUP BY hour
  ORDER BY hour DESC
  LIMIT 50
"""

print("Sessions per hour:")
df_agg = pd.read_sql(query, conn)
print(df_agg)


query = """
SELECT
  DISTINCT attributes->>'session.id' as session_id
FROM records
WHERE start_timestamp > now() - interval '1 hour'
LIMIT 100
"""

print("Recent sessions:")
df_recent = pd.read_sql(query, conn)
print(df_recent)

query = """
SELECT
  span_name as reactive_name,
  AVG((end_timestamp - start_timestamp)::numeric) / 1000 / 1000 as avg_duration_sec
FROM records
WHERE otel_scope_name = 'co.posit.python-package.shiny'
GROUP BY reactive_name
ORDER BY avg_duration_sec DESC
LIMIT 10
"""

df_reactive_dur = pd.read_sql(query, conn)
print(df_reactive_dur)

conn.close()
This final query to get the average duration of Shiny reactive spans will yield something like:
                              reactive_name  avg_duration_sec
0                             session.start          3.220117
1                           reactive_update          2.470269
2                          output n_squared          2.004367
3       reactive.calc expensive_calculation          1.717563
4                             output result          0.252075
5      reactive.calc event complex_analysis          0.251454
6  reactive.effect event track_calculations          0.002223
7        reactive.effect track_calculations          0.001588
8                               session.end          0.001336
9                 output calculation_result          0.000657
Learn more
OpenTelemetry integration in Shiny provides powerful observability for production applications. For more information:
- OpenTelemetry Python documentation
- OpenTelemetry documentation
- Logfire documentation
- Shiny for Python API reference
For related topics on improving Shiny apps: