Theming
shinythemes
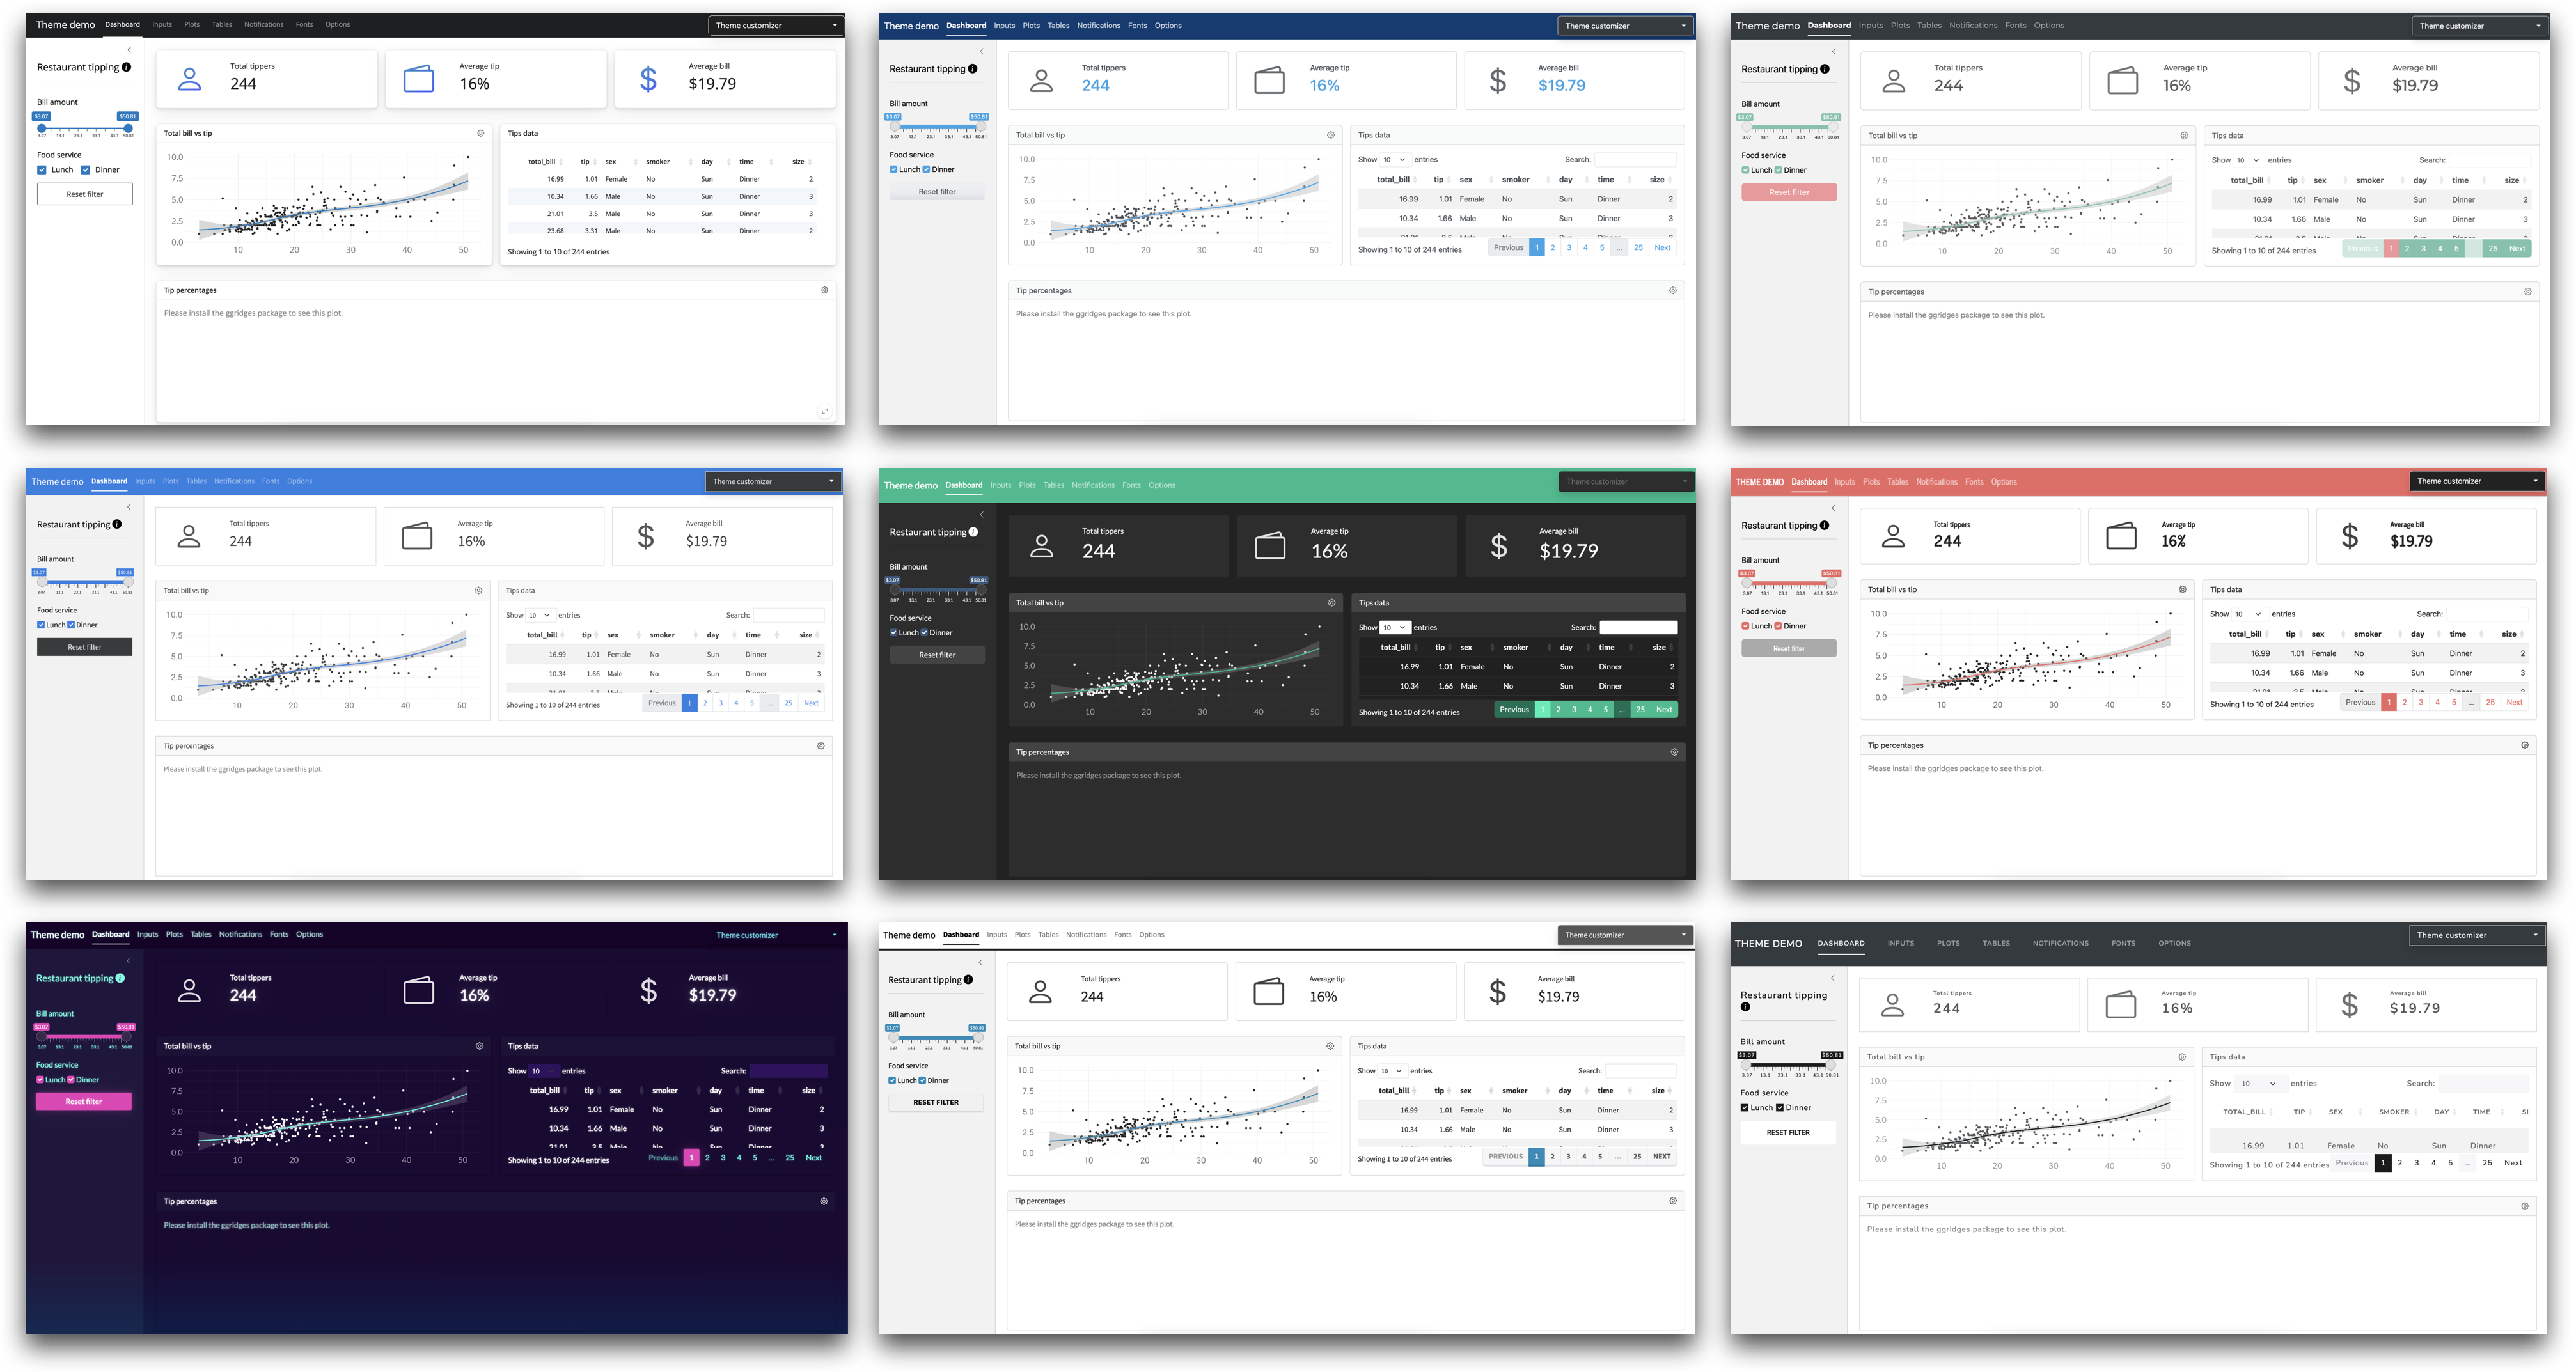
There are many other ways of customizing the look of your app, including using custom CSS. However one quick and easy way of changing the look is using a Bootswatch theme.
bs_themer()
A useful tool to browse and experiment with themes is the bs_themer() widget. To use this widget, simply call this function inside your app’s server logic.
ui <- page_sidebar(
  title = "My app"
)

server <- function(input, output) {
  bs_themer()

}

shinyApp(ui, server)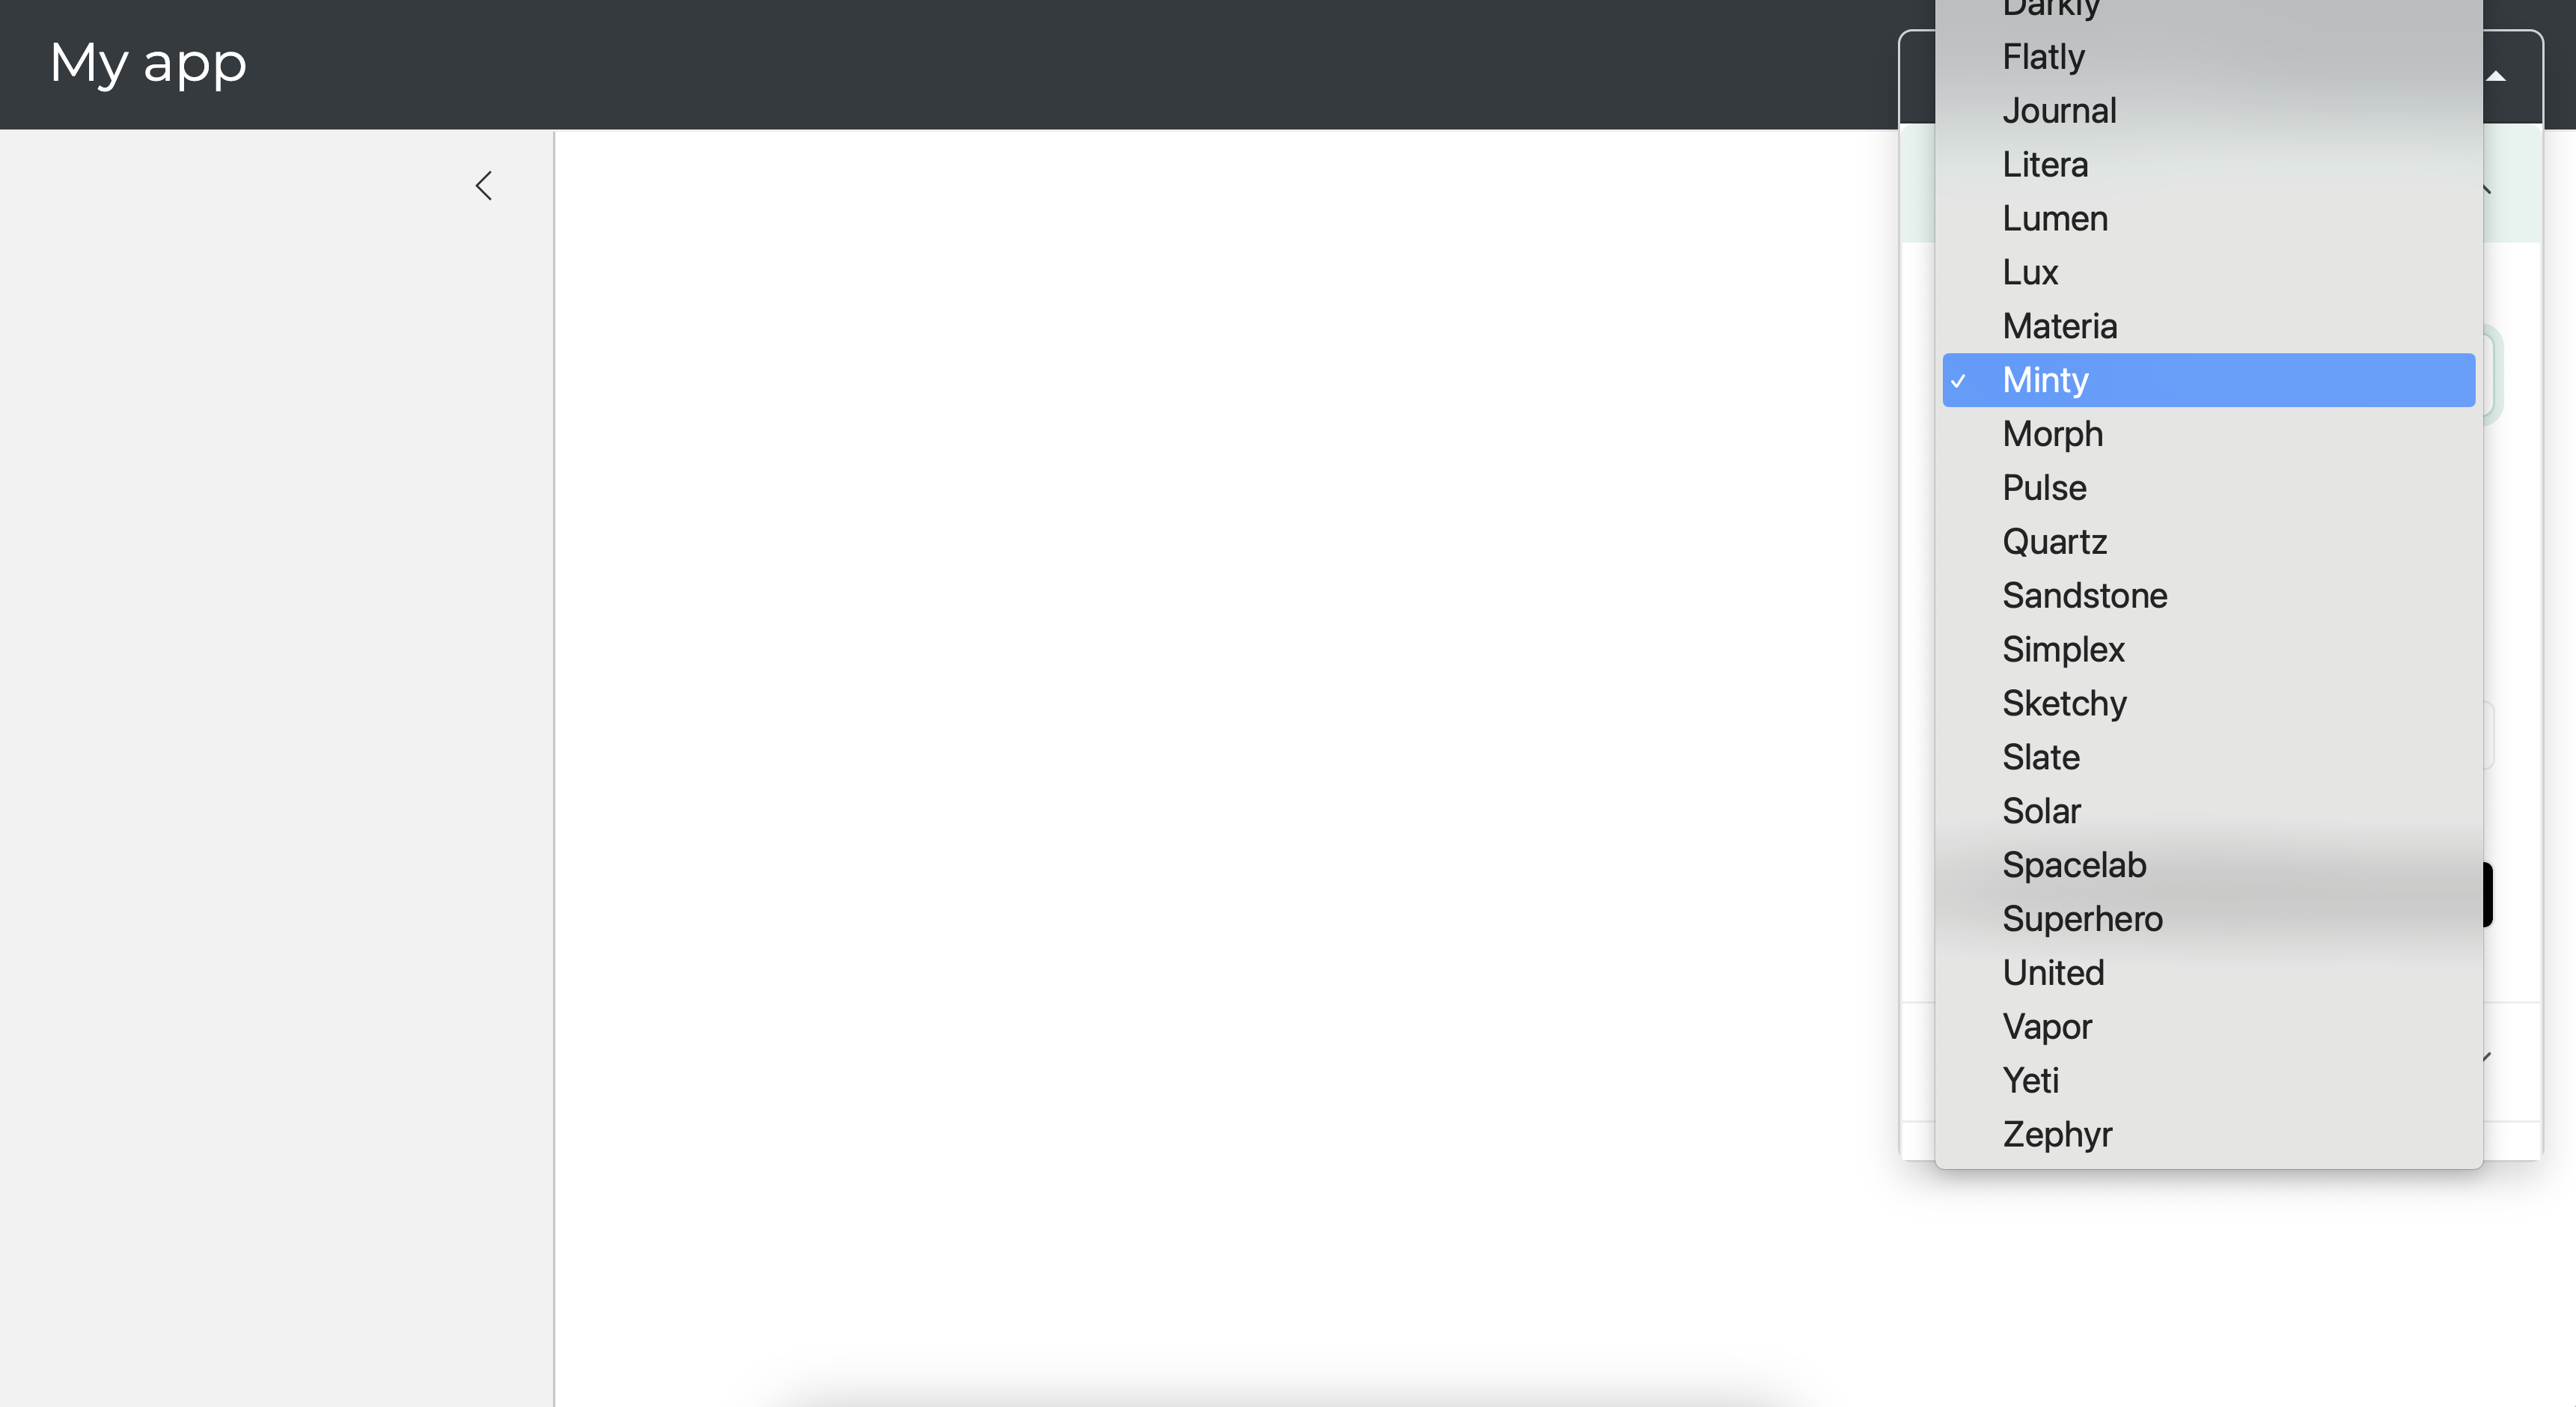
Only use the bs_themer() widget in development. Once you decide on a theme, you should remove the widget.
Then, define your desired theme by using bs_theme() to supply a Bootstrap theme object to the theme argument of your page_* function. Use bs_theme()’s preset argument to use a preset bslib or Bootswatch theme.
ui <- page_sidebar(
  title = "My app",
  ...
  theme = bs_theme(preset = "minty")
)

server <- function(input, output) {

}

shinyApp(ui, server)
bs_theme() also includes arguments for customizing the main background color (bg), foreground color (fg), accent colors (primary, secondary, etc), and fonts (base_font, heading_font, code_font, etc).
ui <- page_sidebar(
  title = "My app",
  ...
  theme = bs_theme(
    bg = "#101010",
    fg = "#FFF",
    primary = "#E69F00",
    secondary = "#0072B2",
    success = "#009E73",
    base_font = font_google("Inter"),
    code_font = font_google("JetBrains Mono")
  )
)

server <- function(input, output) {

}

shinyApp(ui, server)
Theming plots
The thematic package provides a functionality for simplified theming of ggplot2, lattice, and {base} R graphics as well as automatic theming of these plots within a Shiny app. Simply put thematic::thematic_shiny() at the top of your Shiny app to have your R plot’s theming defaults inherit from your Shiny theme.
Next up you get to build an app with tabs and see how it looks with different shiny themes.
Practice - Theming
Your turn
- Pick a Bootstrap theme and apply to the existing app.
Complete the exercise by navigating to the Posit Cloud Project titled 4-4 Customize the appearance of your app in your Posit Cloud Workspace
# Load packages ----------------------------------------------------------------

library(shiny)
library(bslib)
library(ggplot2)
library(tools)

# Load data --------------------------------------------------------------------

load("movies.RData")

# Define UI --------------------------------------------------------------------

ui <- page_sidebar(
    sidebar = sidebar(
      selectInput(
        inputId = "y",
        label = "Y-axis:",
        choices = c(
          "IMDB rating" = "imdb_rating",
          "IMDB number of votes" = "imdb_num_votes",
          "Critics Score" = "critics_score",
          "Audience Score" = "audience_score",
          "Runtime" = "runtime"
        ),
        selected = "audience_score"
      ),

      selectInput(
        inputId = "x",
        label = "X-axis:",
        choices = c(
          "IMDB rating" = "imdb_rating",
          "IMDB number of votes" = "imdb_num_votes",
          "Critics Score" = "critics_score",
          "Audience Score" = "audience_score",
          "Runtime" = "runtime"
        ),
        selected = "critics_score"
      ),

      selectInput(
        inputId = "z",
        label = "Color by:",
        choices = c(
          "Title Type" = "title_type",
          "Genre" = "genre",
          "MPAA Rating" = "mpaa_rating",
          "Critics Rating" = "critics_rating",
          "Audience Rating" = "audience_rating"
        ),
        selected = "mpaa_rating"
      ),

      sliderInput(
        inputId = "alpha",
        label = "Alpha:",
        min = 0, max = 1,
        value = 0.5
      ),

      sliderInput(
        inputId = "size",
        label = "Size:",
        min = 0, max = 5,
        value = 2
      ),

      textInput(
        inputId = "plot_title",
        label = "Plot title",
        placeholder = "Enter text to be used as plot title"
      ),

      actionButton(
        inputId = "update_plot_title",
        label = "Update plot title"
      )
    ),

    card(
      markdown(
        "These data were obtained from [IMBD](http://www.imbd.com/) and [Rotten Tomatoes](https://www.rottentomatoes.com/).

        The data represent 651 randomly sampled movies released between 1972 to 2014 in the United States."
      ),
      plotOutput(outputId = "scatterplot")
    )
)

# Define server ----------------------------------------------------------------

server <- function(input, output, session) {
  new_plot_title <- eventReactive(
    eventExpr = input$update_plot_title,
    valueExpr = {
      toTitleCase(input$plot_title)
    }
  )

  output$scatterplot <- renderPlot({
    ggplot(data = movies, aes_string(x = input$x, y = input$y, color = input$z)) +
      geom_point(alpha = input$alpha, size = input$size) +
      labs(title = new_plot_title())
  })
}

# Create the Shiny app object --------------------------------------------------

shinyApp(ui = ui, server = server)# Load packages ----------------------------------------------------------------
library(shiny)
library(bslib)
library(ggplot2)
library(tools)
# Load data --------------------------------------------------------------------
load("movies.RData")
# Define UI --------------------------------------------------------------------
ui <- page_sidebar(theme = bs_theme(preset = "vapor"),
sidebar = sidebar(
selectInput(
inputId = "y",
label = "Y-axis:",
choices = c(
"IMDB rating" = "imdb_rating",
"IMDB number of votes" = "imdb_num_votes",
"Critics Score" = "critics_score",
"Audience Score" = "audience_score",
"Runtime" = "runtime"
),
selected = "audience_score"
),
selectInput(
inputId = "x",
label = "X-axis:",
choices = c(
"IMDB rating" = "imdb_rating",
"IMDB number of votes" = "imdb_num_votes",
"Critics Score" = "critics_score",
"Audience Score" = "audience_score",
"Runtime" = "runtime"
),
selected = "critics_score"
),
selectInput(
inputId = "z",
label = "Color by:",
choices = c(
"Title Type" = "title_type",
"Genre" = "genre",
"MPAA Rating" = "mpaa_rating",
"Critics Rating" = "critics_rating",
"Audience Rating" = "audience_rating"
),
selected = "mpaa_rating"
),
sliderInput(
inputId = "alpha",
label = "Alpha:",
min = 0, max = 1,
value = 0.5
),
sliderInput(
inputId = "size",
label = "Size:",
min = 0, max = 5,
value = 2
),
textInput(
inputId = "plot_title",
label = "Plot title",
placeholder = "Enter text to be used as plot title"
),
actionButton(
inputId = "update_plot_title",
label = "Update plot title"
)
),
card(
markdown(
"These data were obtained from [IMBD](http://www.imbd.com/) and [Rotten Tomatoes](https://www.rottentomatoes.com/).
The data represent 651 randomly sampled movies released between 1972 to 2014 in the United States."
),
plotOutput(outputId = "scatterplot")
)
)
# Define server ----------------------------------------------------------------
server <- function(input, output, session) {
new_plot_title <- eventReactive(
eventExpr = input$update_plot_title,
valueExpr = {
toTitleCase(input$plot_title)
}
)
output$scatterplot <- renderPlot({
ggplot(data = movies, aes_string(x = input$x, y = input$y, color = input$z)) +
geom_point(alpha = input$alpha, size = input$size) +
labs(title = new_plot_title())
})
}
# Create the Shiny app object --------------------------------------------------
shinyApp(ui = ui, server = server)