Reactive Elements
Diving deeper into reactive programming
Reactive objects
In this section we discuss reactivity in a bit more detail.
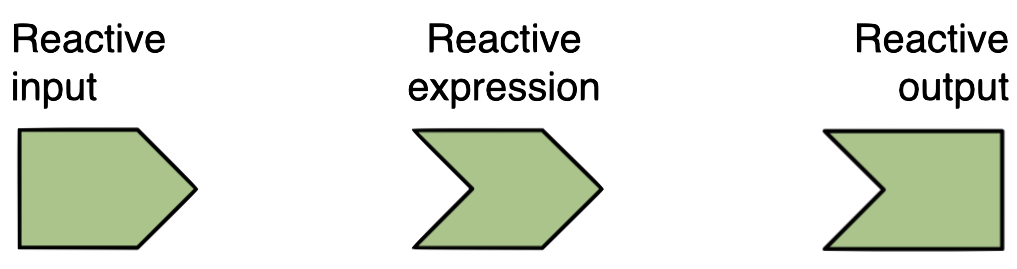
Three components of reactive execution in Shiny are
- reactive inputs,
- reactive expressions, and
- reactive outputs.
We’re going to denote them with these symbols:
Reactive inputs and outputs
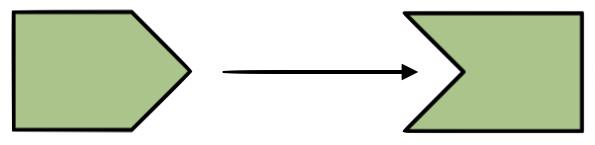
- A reactive input is a user input that comes through a browser interface, typically.
- A reactive output is something that appears in the user’s browser window, such as a plot or a table of values.
- One reactive input can be connected to multiple outputs, and vice versa. For example we might have a UI input widget for filtering out data based on user’s selection, and the filtered data can be used in multiple outputs like plots and summaries.
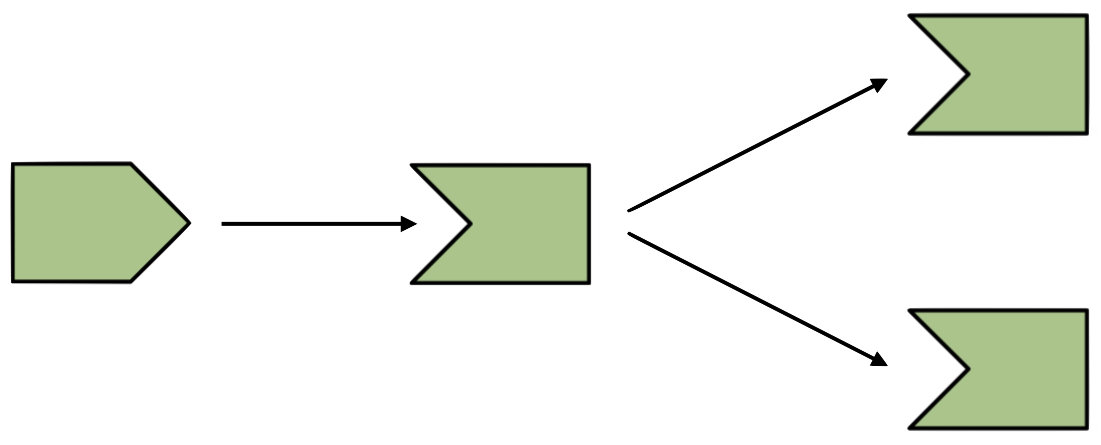
Reactive expressions
A reactive expressions is component between an input and an output.
It can both be a dependent (i.e be a child) and have dependents (i.e. be a parent).
Practice
Which of the following is false? Select all that apply.
- Reactive inputs can only be parents.
- Reactive inputs can only be children.
- Reactive expressions can be parents.
- Reactive expressions can be children.
- Reactive outputs can be parents.
- Reactive outputs can be children.
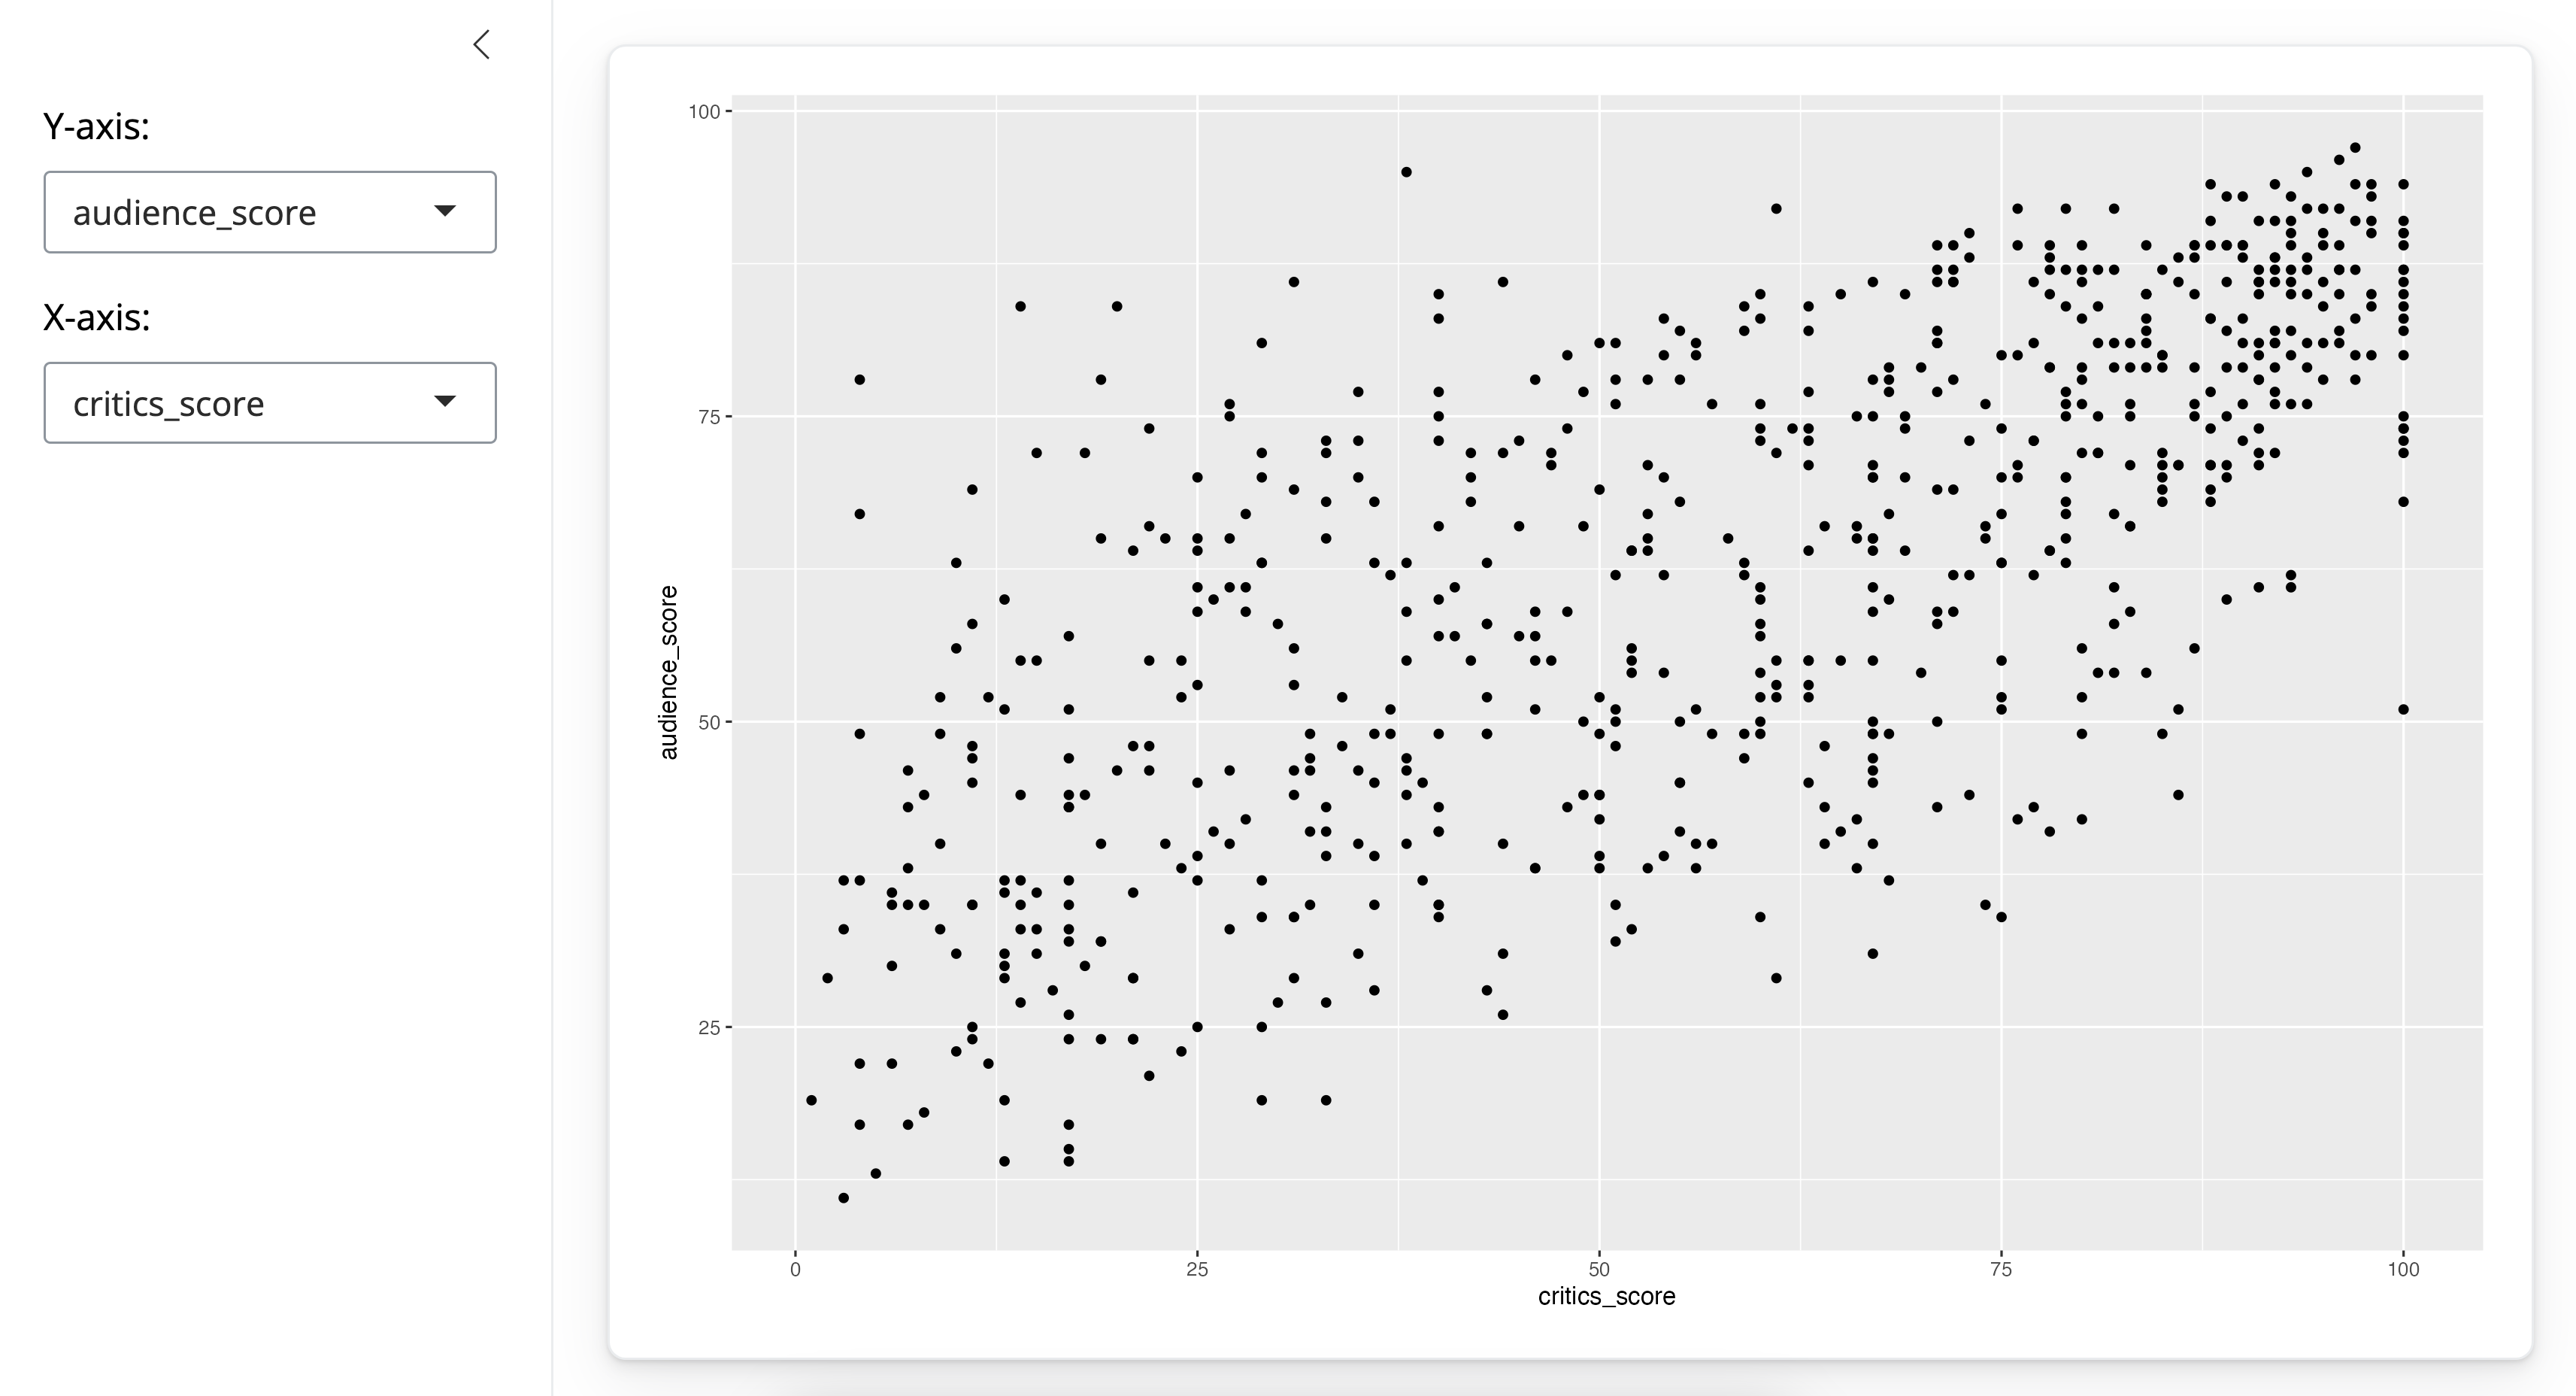
To illustrate reactivity we’re going to start with this app once again
And end up with an app that…
- lets the user subset the data by movie type
- updates the plot for those selected movie types
- and display some text noting the number of movies in the selection
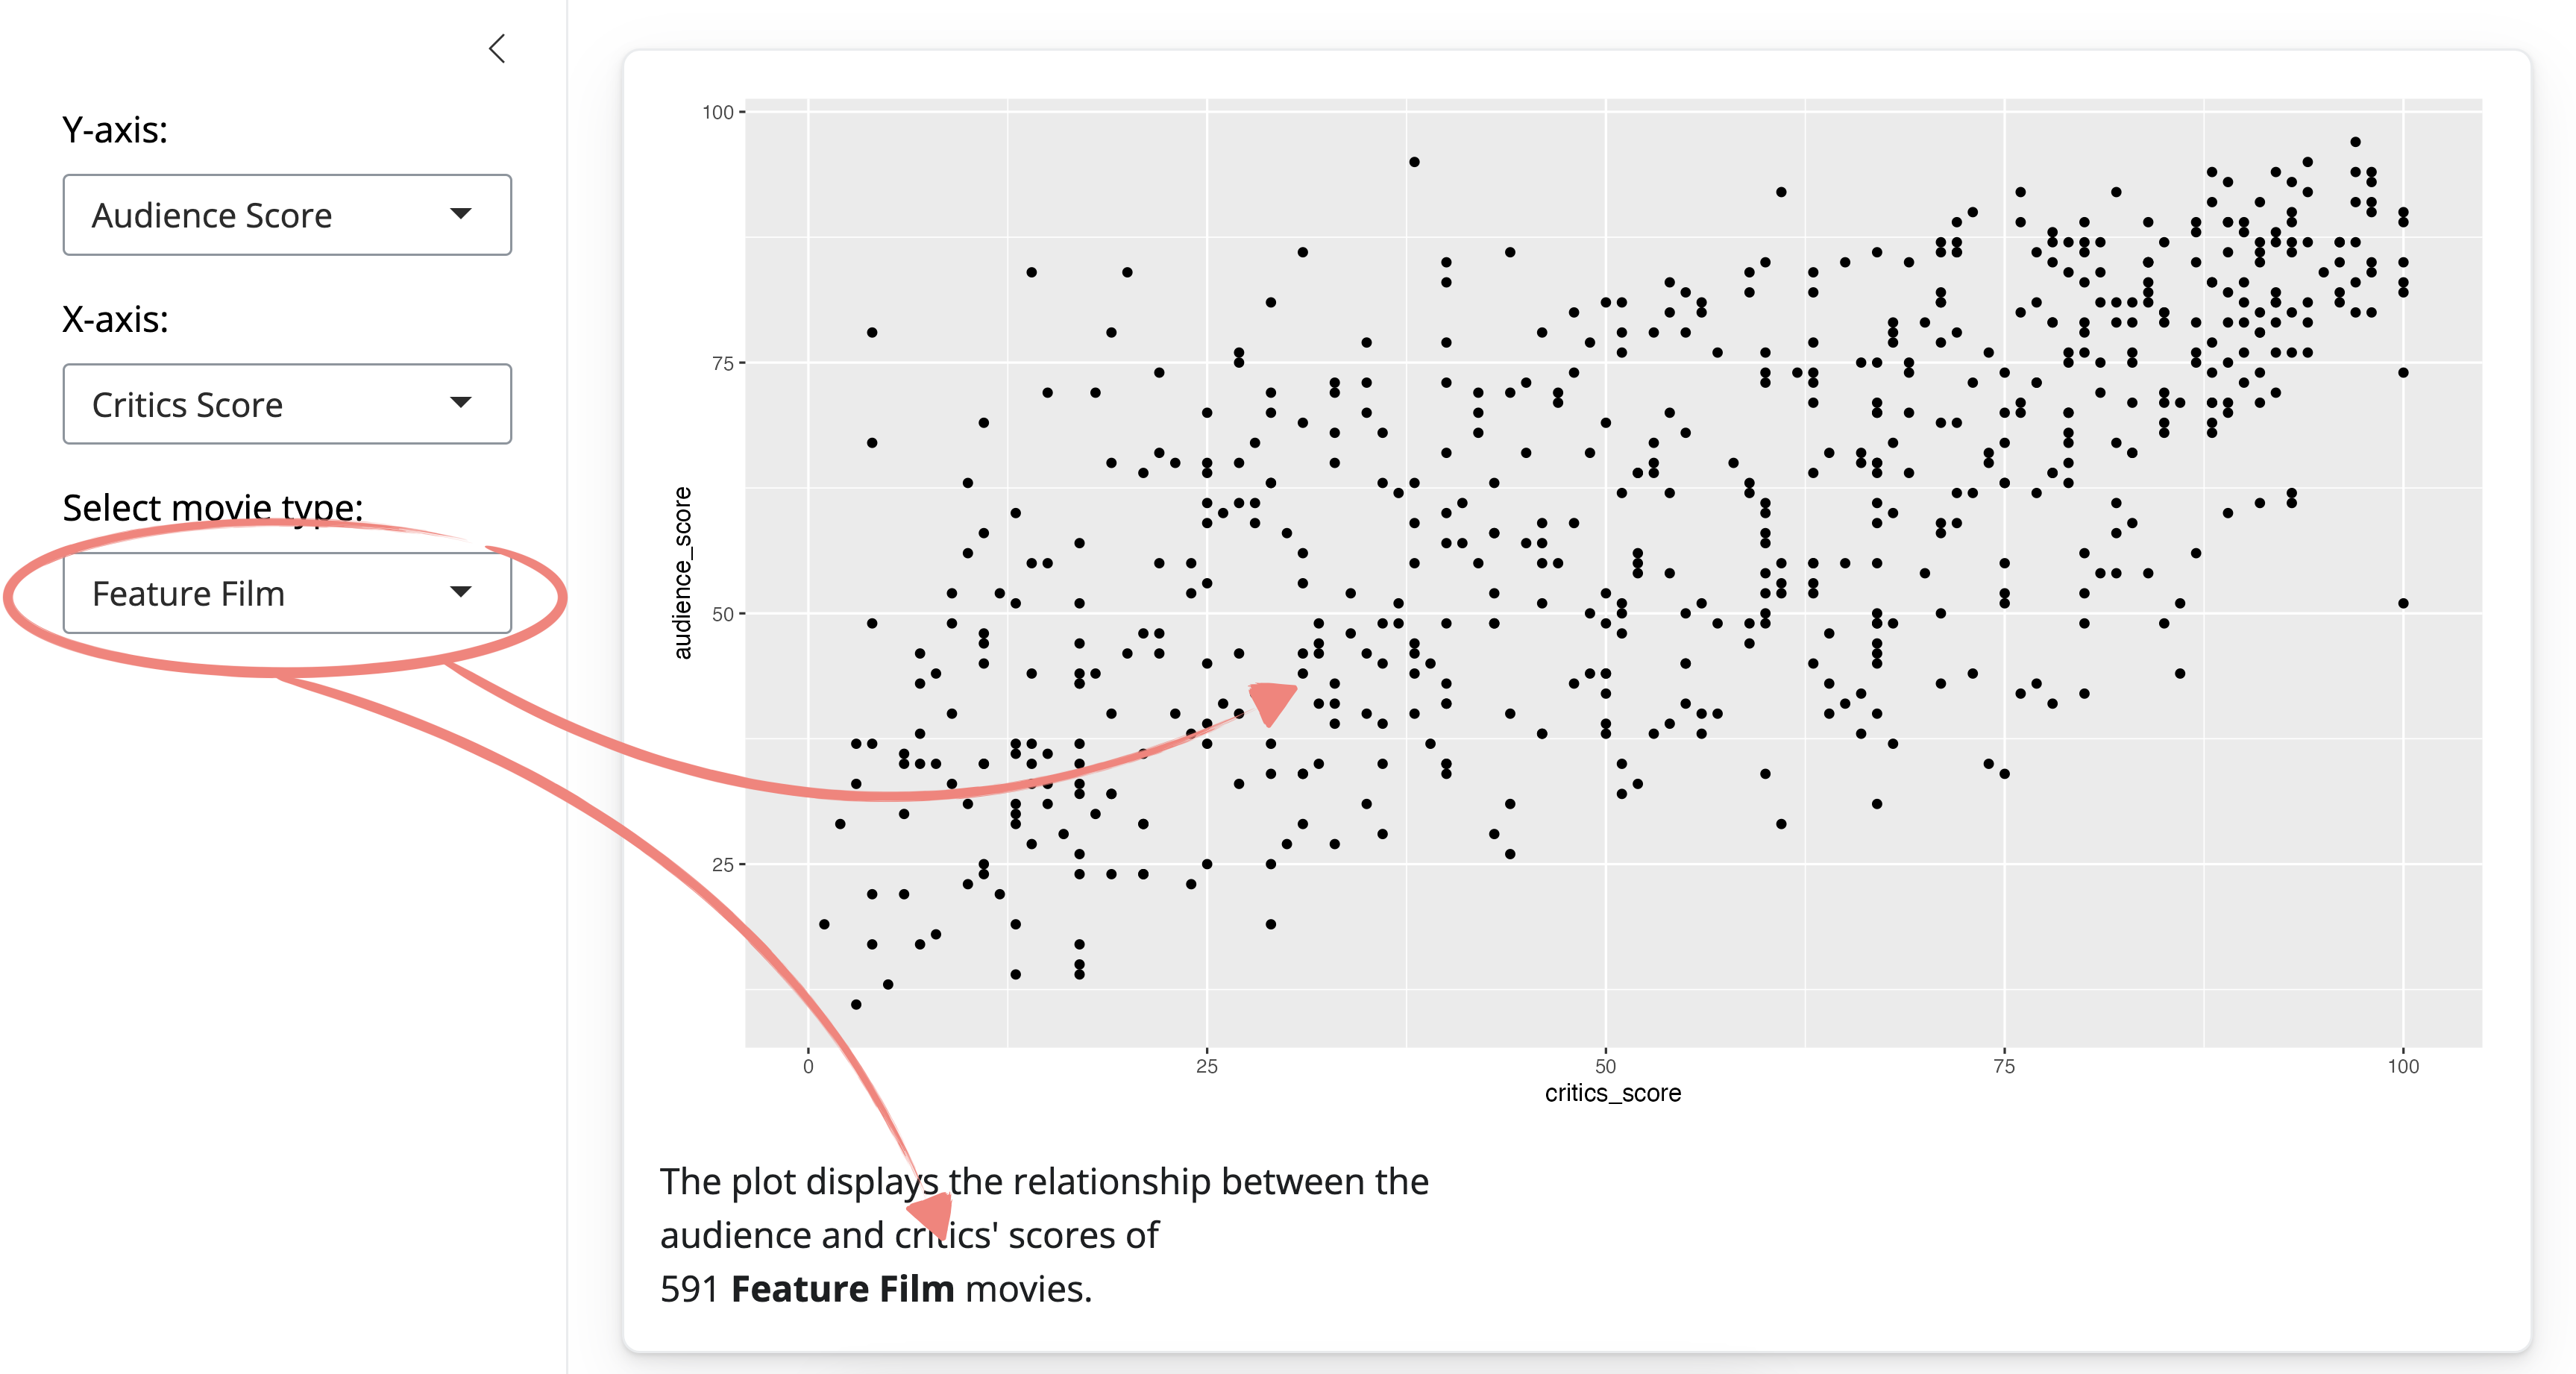
The subsetted movies data frame gets used in two places, plot and text outputs. Hence, we we’re going to make use of reactive expressions to build this app.
1. ui: Add a UI element for the user to select which movie type(s) of moves they want to plot with selectInput().
# Select which types of movies to plot
selectInput(
  inputId = "selected_type",
  label = "Select movie type:",
  choices = levels(movies$title_type),
  selected = "Feature Film"
)- We define an
inputId()that we’ll use to refer to the input element to later in the app - We come up with a user facing
label - We specify the choices users can select from,
- as well as a default choice
2. server: Filter for chosen title type and save the new data frame as a reactive expression.
Next, we filter for selected title type and save the new data frame as a reactive expression using the reactive() function.

# Create a subset of data filtering for chosen title types
movies_subset <- reactive({
  req(input$selected_type)
  filter(movies, title_type %in% input$selected_type)
})
This function creates a cached expression that knows it is out of date when its input changes. So you, the Shiny developer, do not need to worry about keeping track of when the input changes, Shiny automatically does that for you.
Two more things to note here:
- Before we do any calculations that depends on
input$selected_type, we check its availability with thereq()function, and - We surround the expression with curly braces
3. server: Use movies_subset (which is reactive) for plotting.
The next two steps could happen in either order. Let’s start with the plot first.
# Create scatterplot
output$scatterplot <- renderPlot({
  ggplot(data = movies_subset(),aes_string(x = input$x, y = input$y)) +
    geom_point()
})
You should be familiar with creating plots using the renderPlot() function by now. But there is something new here. The data frame we’re using is no longer movies, but the new reactive expression we created. And because it’s reactive we refer to it with parentheses after its name. This is, once again, a cached expression, meaning that it will only rerun when its inputs change.
4. ui & server: Use movies_subset (which is reactive) for printing number of observations.
And lastly we create the text stating the number of observations in the selection. The obvious choice for creating this output would be renderText(). But I feel like getting a little fancier with this one. Suppose we know a bit of HTML – which is true, I really only know a bit of HTML – and I want to use some text decoration, like bolding and line breaks in my text output. So we need a rendering function that generates HTML, which is renderUI().
# ui - Lay out where text should appear on app
card(
  ...
  # Print number of obs plotted
  uiOutput(outputId = "n"),
  ...
)
# server - Print number of movies plotted
output$n <- renderUI({
HTML(paste0(
"The plot displays the relationship between the <br>
audience and critics' scores of <br>",
nrow(movies_subset()),
" <b>", input$selected_type, "</b> movies."
))
})We use the paste() function to string along the text of the sentence we want displayed on the app. This sentence depends on the value of the number of rows of the movies_subset reactive expression we created earlier, as well as input$selected type.
Using simple HTML we add some decoration to the text, and finally wrap the whole thing up in a function that marks the given text as HTML.
Then on the ui side, we use the counterpart uiOutput() function to lay out the text on the app.
Practice - Add reactive data frame
We ended the previous chapter with an app that allows you to download a data file with selected variables from the movies dataset. We will now extend this app by adding a table output of the selected data as well. Given that the same dataset will be used in two outputs, it makes sense to make our code more efficient by using a reactive data frame.
Extend app by adding reactive data frame, which is a subset, that is used in the plot.
Your turn
Define
movies_selected: a reactive data frame consisting of selected variables (input$selected_var).Use the newly constructed
movies_selectedreactive data frame to avoid reconstructing the subsetted data frame multiple times throughout the app.
Complete the exercise by navigating to the Posit Cloud Project titled 3-1 Add reactive data frame in your Posit Cloud Workspace
- Download the data if you haven’t already
```{r}
# Get the data

file <- "https://github.com/rstudio-education/shiny-course/raw/main/movies.RData"
destfile <- "movies.RData"

download.file(file, destfile)
```- Copy the code below into an R script
# Load packages ----------------------------------------------------------------

library(shiny)
library(bslib)
library(dplyr)
library(readr)

# Load data --------------------------------------------------------------------

load("movies.RData")

# Define UI --------------------------------------------------------------------

ui <- page_sidebar(

    sidebar = sidebar(
      radioButtons(
        inputId = "filetype",
        label = "Select filetype:",
        choices = c("csv", "tsv"),
        selected = "csv"
      ),

      checkboxGroupInput(
        inputId = "selected_var",
        label = "Select variables:",
        choices = names(movies),
        selected = c("title")
      )
    ),

    card(
      dataTableOutput(outputId = "moviestable"),
      downloadButton("download_data", "Download data")
    )
)

# Define server ----------------------------------------------------------------

server <- function(input, output, session) {

  # Create reactive data frame
  movies_selected <- ___

  # Create data table
  output$moviestable <- DT::renderDataTable({
    req(input$selected_var)
    datatable(
      data = movies %>% select(input$selected_var),
      options = list(pageLength = 10),
      rownames = FALSE
    )
  })

  # Download file
  output$download_data <- downloadHandler(
    filename = function() {
      paste0("movies.", input$filetype)
    },
    content = function(file) {
      if (input$filetype == "csv") {
        write_csv(movies %>% select(input$selected_var), file)
      }
      if (input$filetype == "tsv") {
        write_tsv(movies %>% select(input$selected_var), file)
      }
    }
  )
}

# Create the Shiny app object --------------------------------------------------

shinyApp(ui = ui, server = server)# Load packages ----------------------------------------------------------------
library(shiny)
library(bslib)
library(dplyr)
library(readr)
# Load data --------------------------------------------------------------------
load("movies.RData")
# Define UI --------------------------------------------------------------------
ui <- page_sidebar(
sidebar = sidebar(
radioButtons(
inputId = "filetype",
label = "Select filetype:",
choices = c("csv", "tsv"),
selected = "csv"
),
checkboxGroupInput(
inputId = "selected_var",
label = "Select variables:",
choices = names(movies),
selected = c("title")
)
),
card(
dataTableOutput(outputId = "moviestable"),
downloadButton("download_data", "Download data")
)
)
# Define server ----------------------------------------------------------------
server <- function(input, output, session) {
# Create reactive data frame
movies_selected <- reactive({
movies %>% select(input$selected_var)
})
# Create data table
output$moviestable <- DT::renderDataTable({
req(input$selected_var)
datatable(
data = movies_selected(),
options = list(pageLength = 10),
rownames = FALSE
)
})
# Download file
output$download_data <- downloadHandler(
filename = function() {
paste0("movies.", input$filetype)
},
content = function(file) {
if (input$filetype == "csv") {
write_csv(movies_selected(), file)
}
if (input$filetype == "tsv") {
write_tsv(movies_selected(), file)
}
}
)
}
# Create the Shiny app object --------------------------------------------------
shinyApp(ui = ui, server = server)Practice: Identify reactive objects
The movies_selected() reactive expression from the previous exercise is a…
- Reactive input
- Reactive expression
- Reactive output
- Reactive paradigm