UI Inputs
The goal of this section is to build familiarity with a few UI input functions.
Once again, we’ll build on our simple movie browser app.
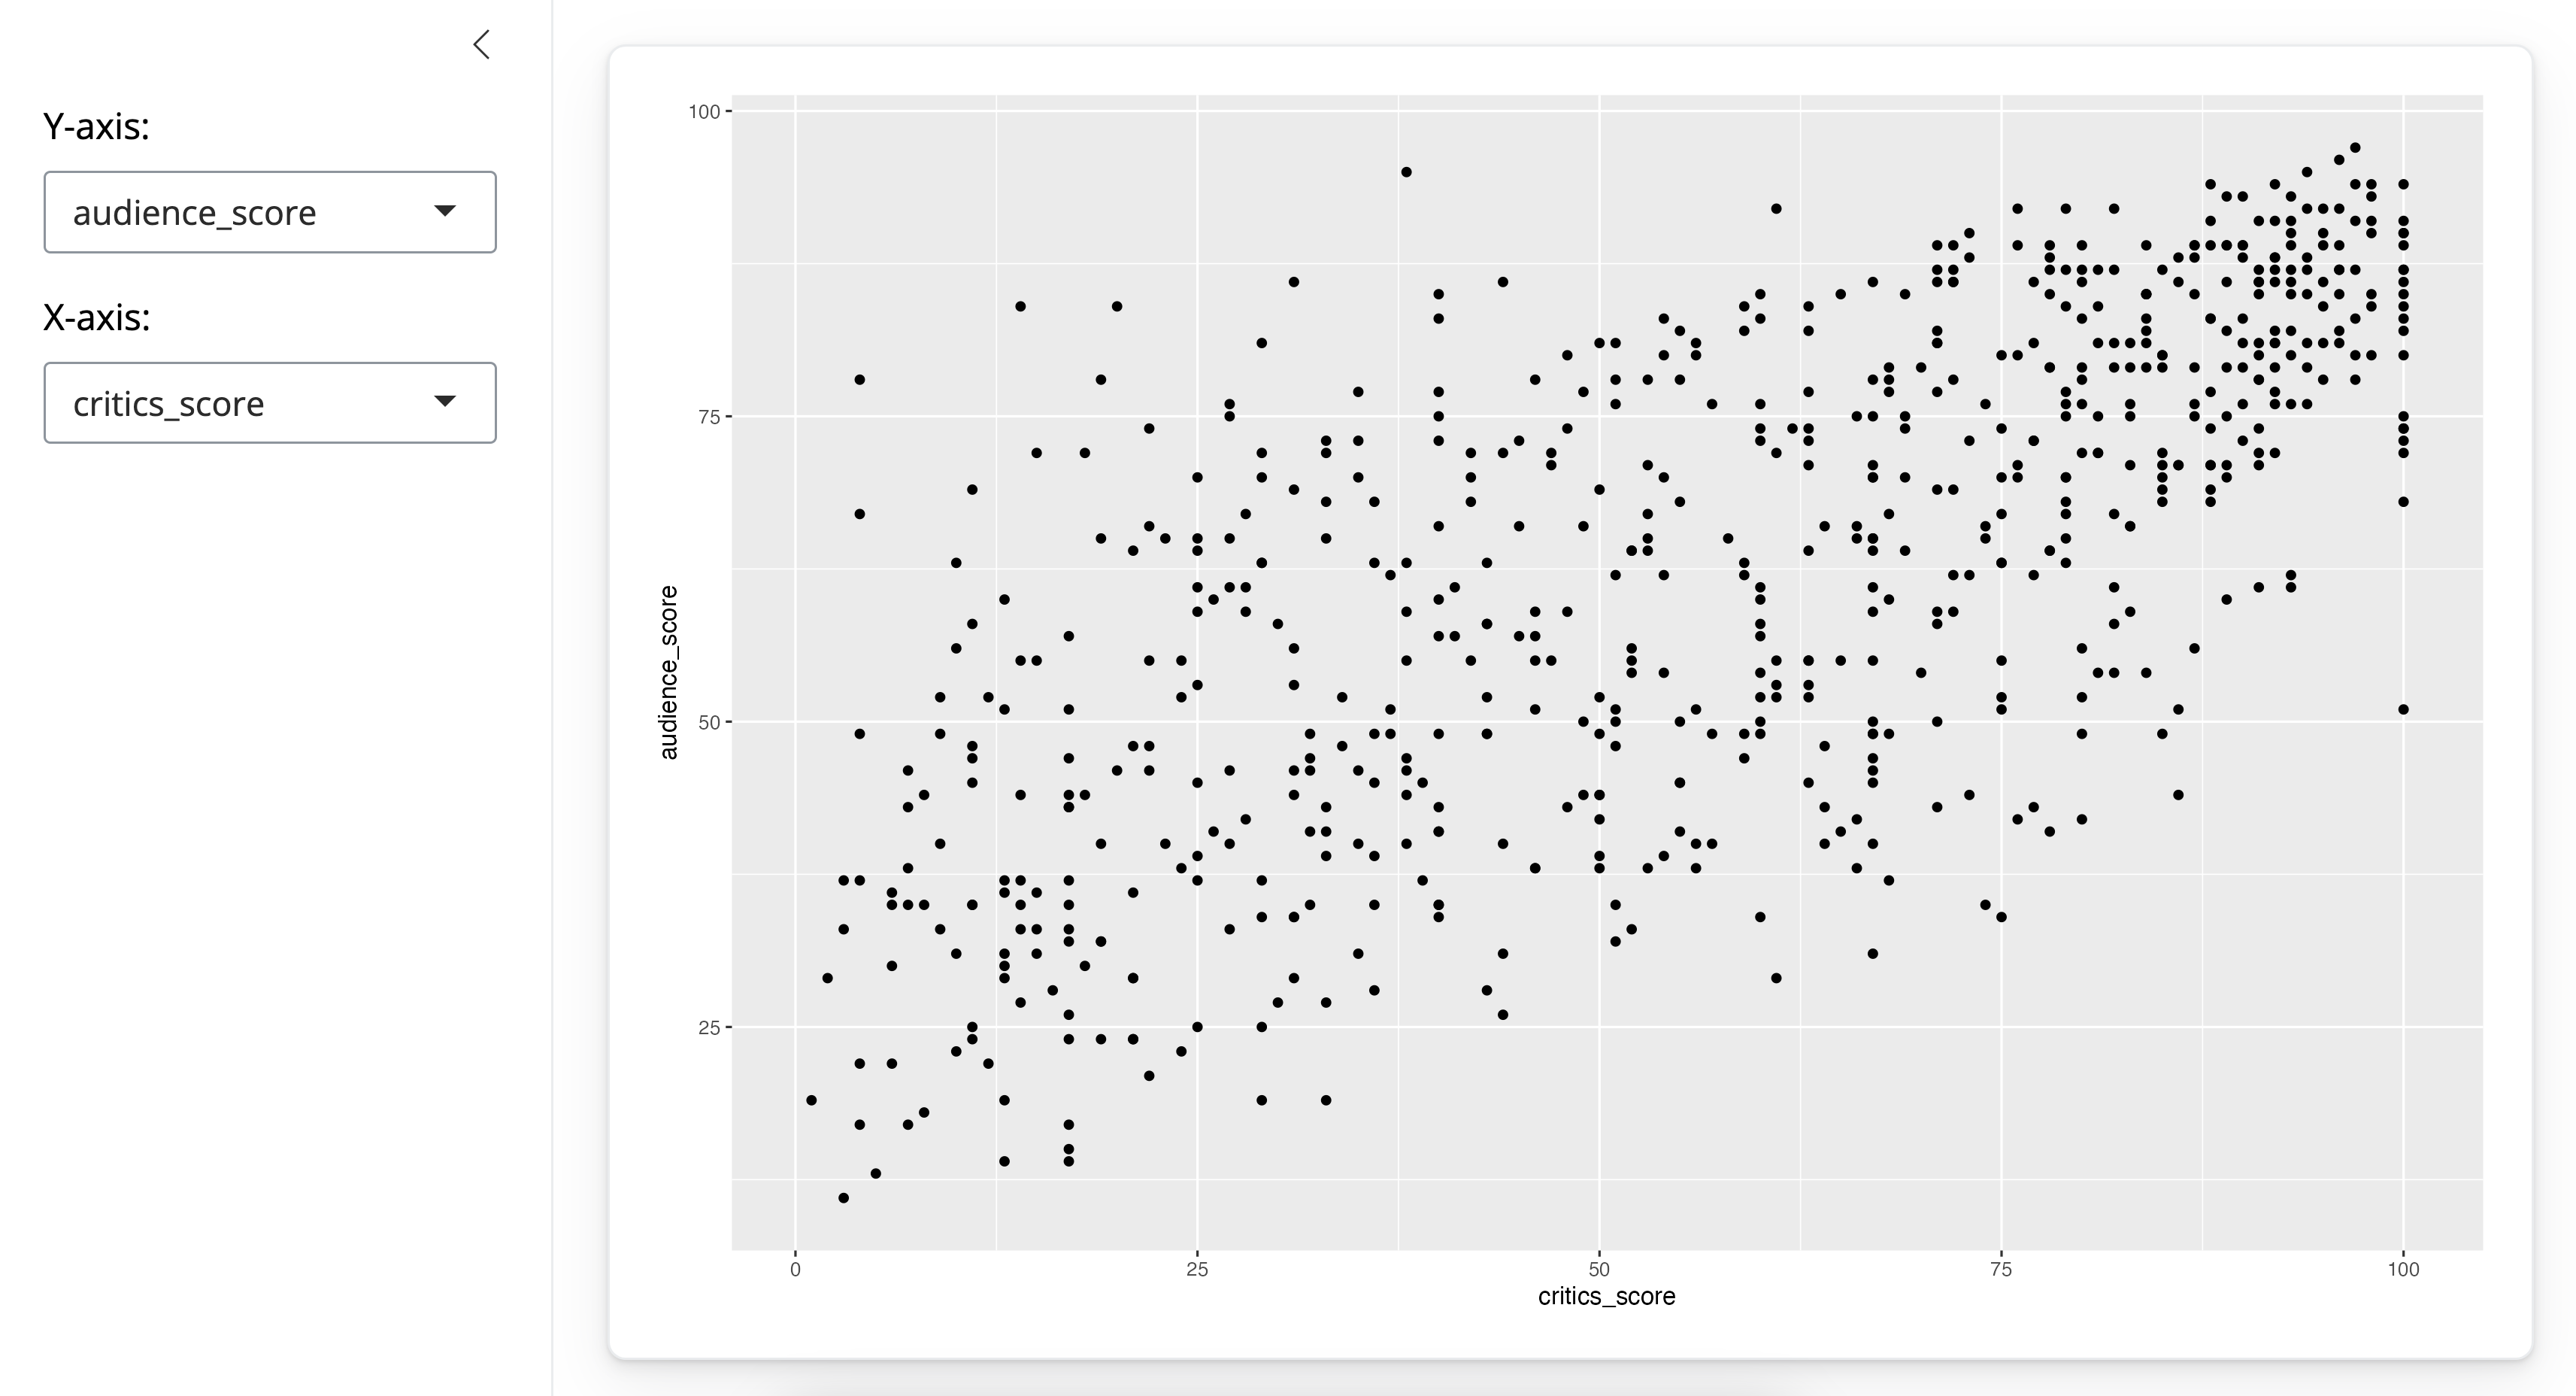
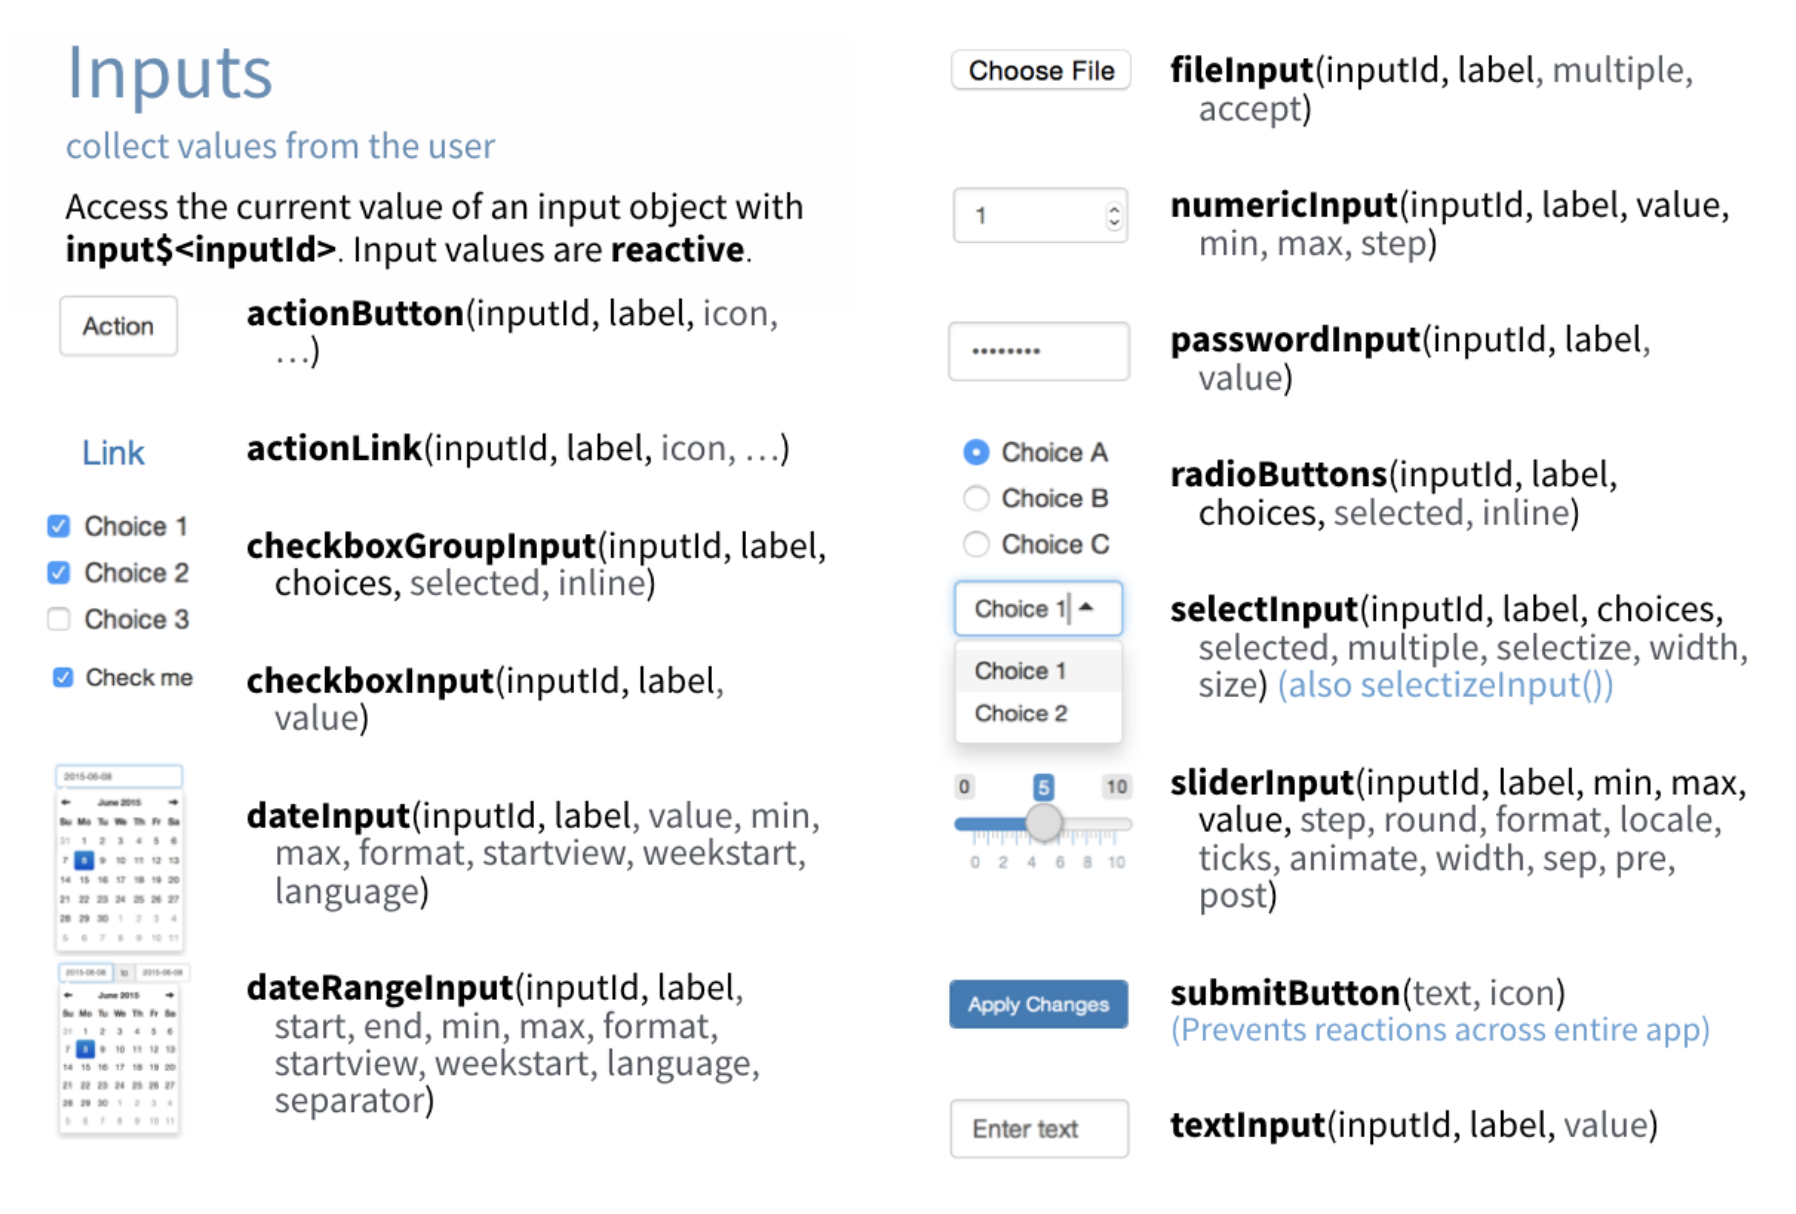
Shiny provides a wide selection of input widgets. The Shiny cheatsheet is a great place to see a list of them all at once.
Once you know which one you want to use, you can find out more about it in the package documentation. You’ll also get a chance to work with some of them in the following exercises.
checkboxInput
Let’s start with a checkboxInput().
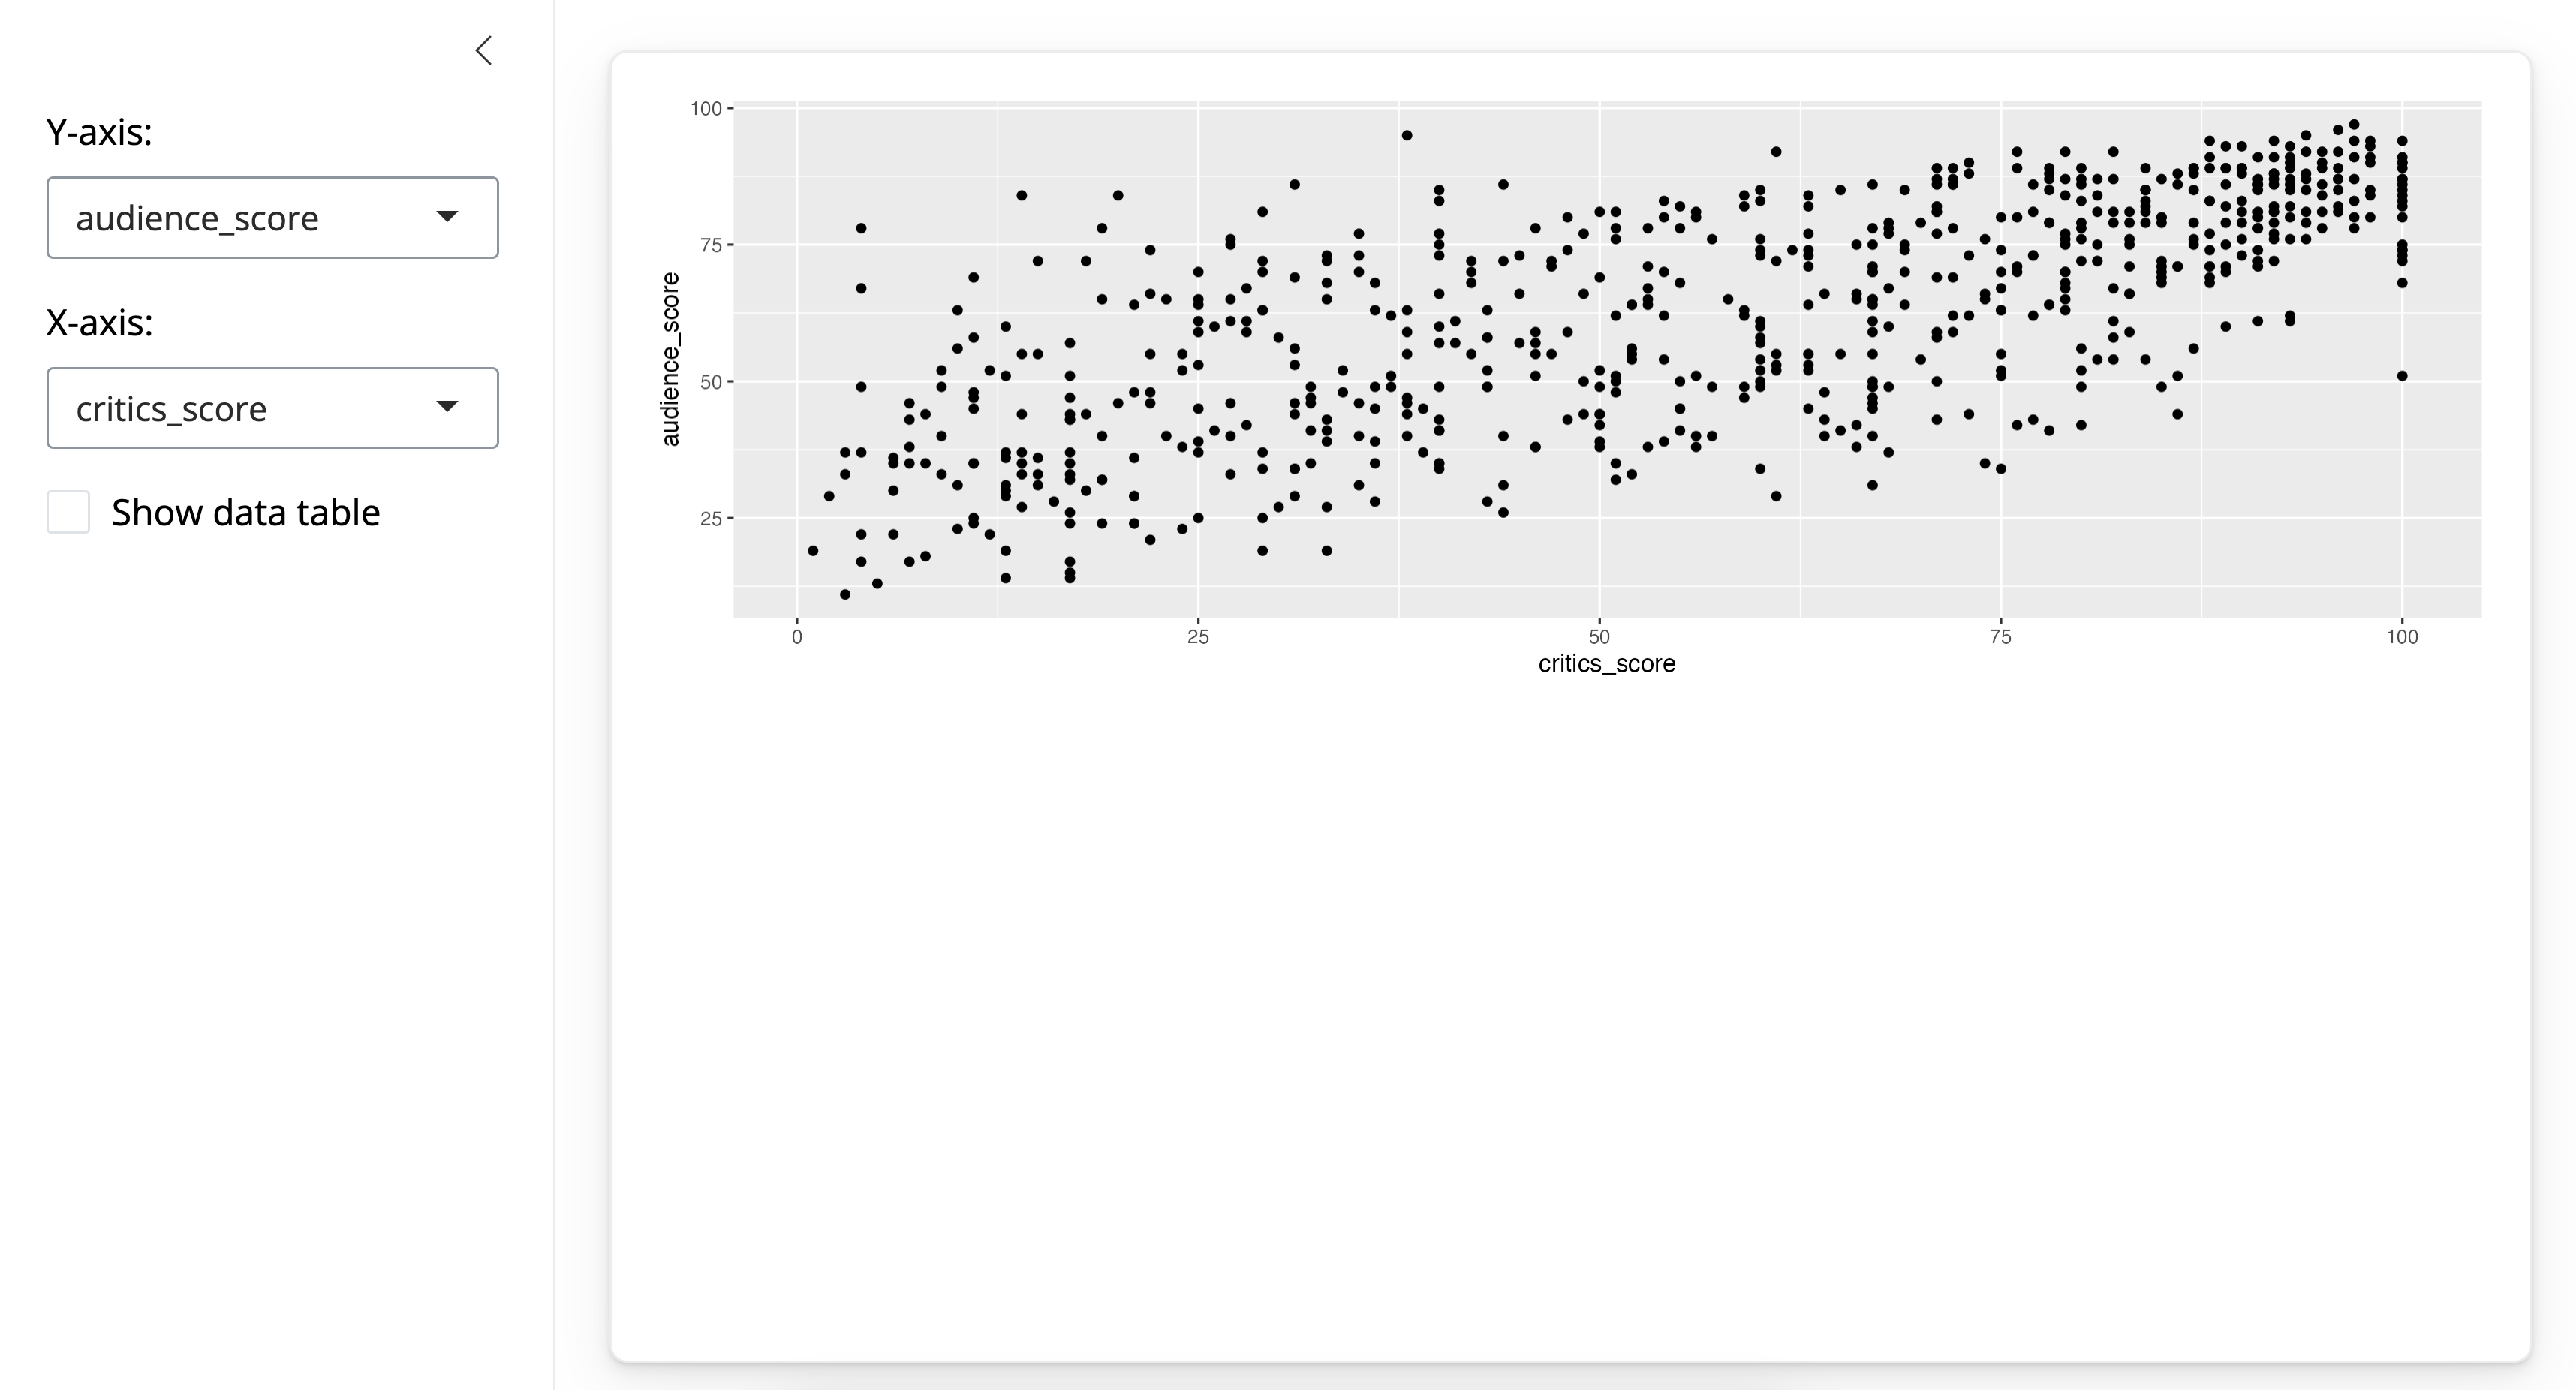
Suppose we want to add checkbox input to our app to specify whether the data plotted should be shown in a data table. We need to make three modifications to our app to accomplish this.
In the ui: Add an input widget that the user can interact with to check/uncheck the box.
In the ui: Add an output to the UI defining where the data table should appear.
In the server function: Add a reactive expression that creates the data table if the checkbox is checked.
We’ll go through these steps one by one.
1. ui: Add an input widget that the user can interact with to check/uncheck the box
# Show data table
checkboxInput(inputId = "show_data",
              label = "Show data table",
value = TRUE)- The first argument is the
inputId, which we can define to be anything we want, but short and informative names are the best. - Next is the
label, which is the user facing description of the widget. - And last is the
value, the initial value of the widget.TRUEmeans the box is initially checked. If you want it to not be checked initially, you’d set it toFALSEinstead.
Watch for commas!
A cautionary tale before we move on – watch for your commas! Remember that this widget definition goes in the sidebar(). In this panel we separate out widget with commas.
sidebar(
    # Select variable for y-axis
    selectInput(inputId = "y", label = "Y-axis:",
                choices = c("imdb_rating", "imdb_num_votes", "critics_score", "audience_score", "runtime"),
                selected = "audience_score"),
    # Select variable for x-axis
    selectInput(inputId = "x", label = "X-axis:",
                choices = c("imdb_rating", "imdb_num_votes", "critics_score", "audience_score", "runtime"),
                selected = "critics_score"),
    # Show data table
    checkboxInput(inputId = "show_data",
                  label = "Show data table", value = TRUE)
)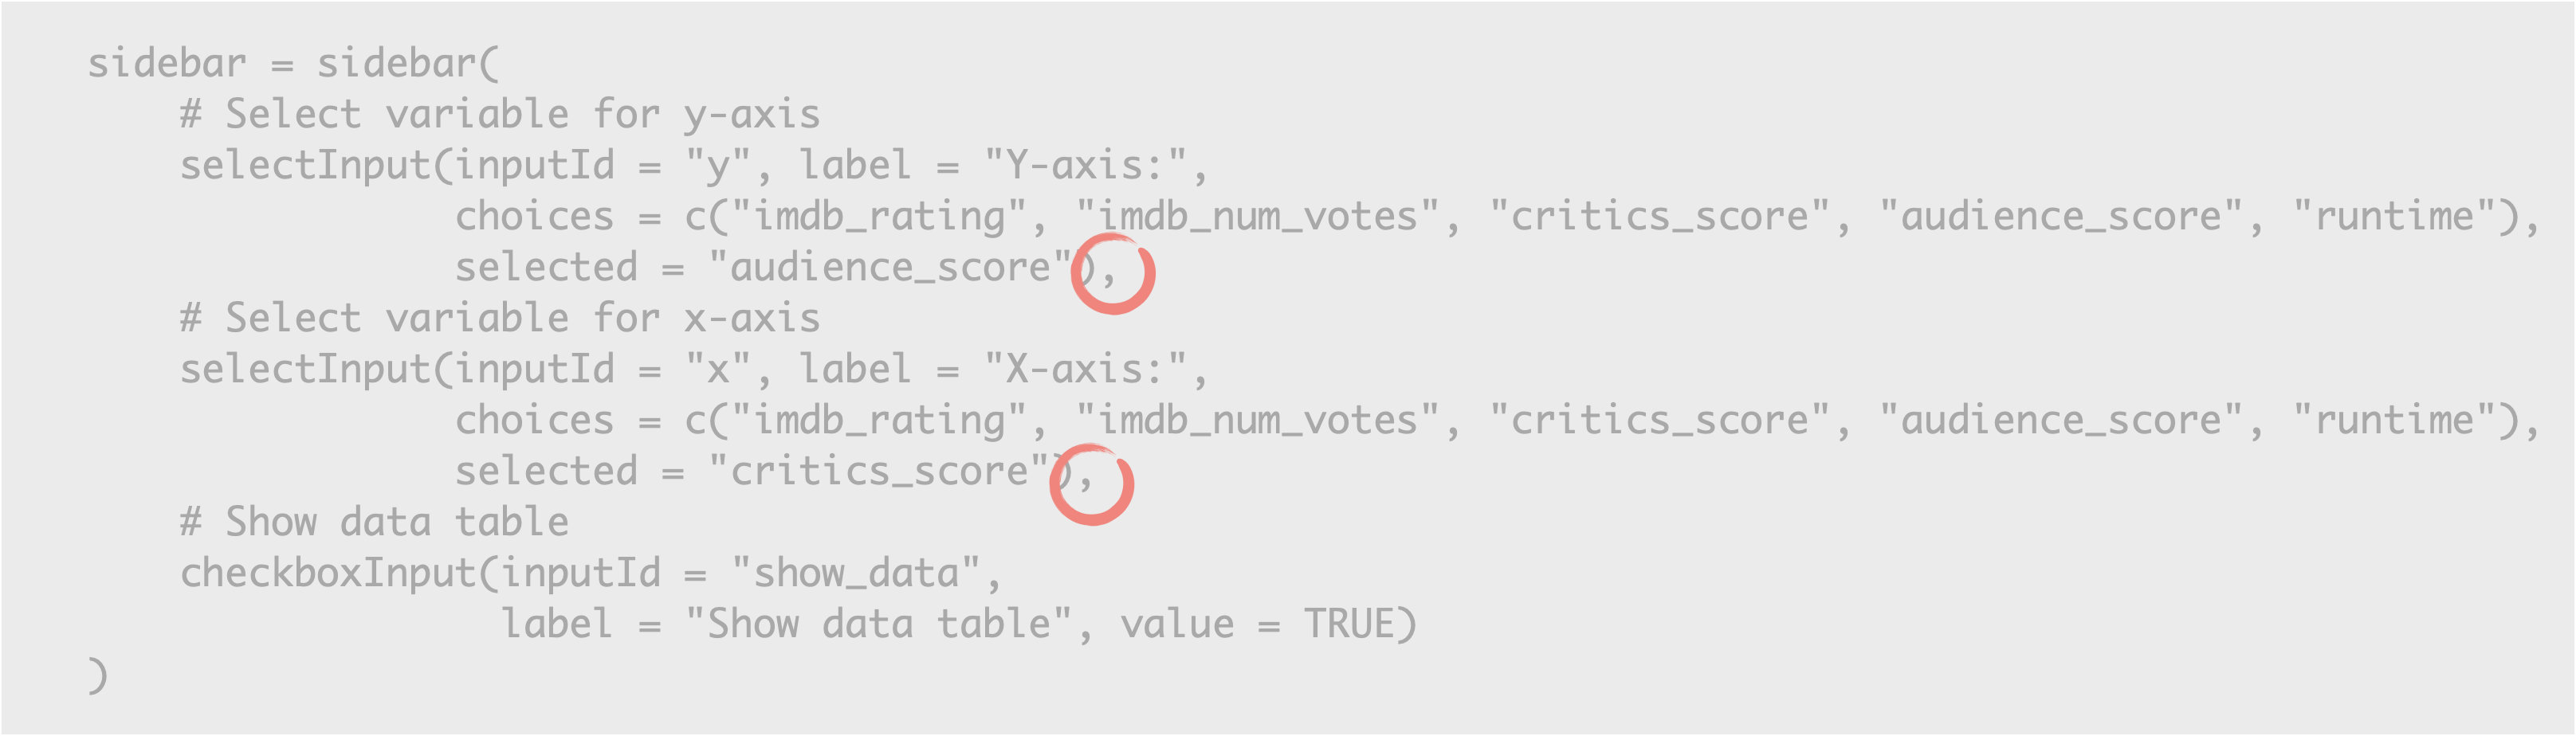
For example:
- The first is the
selectInputwidget for y, then we have a comma, - then another
selectInputand another comma, and - then our new
checkboxInputand no comma after it since it’s the last item in the list.
2. ui: Add an output to the UI defining where the data table should appear.
card(
  # Show scatterplot
  plotOutput(outputId = "scatterplot"),
  # Show data table
  dataTableOutput(outputId = "moviestable")
)
The second step was to add an output to the UI defining where the data table should appear. Note that for this we’re using the dataTableOutput() function.
This function takes one argument, the outputId. Again, you can define to be anything we want, but short and informative names are the best.
3. server: Add a reactive expression that creates the data table if the checkbox is checked.
# Print data table if checked
output$moviestable <- renderDataTable({
  if(input$show_data){
    DT::datatable(data = movies %>% select(1:7),
                  options = list(pageLength = 10),
                  rownames = FALSE)
  }
})
Lastly, in our server, we describe how this table should be calculated. We use the renderDataTable() function to build this table.
Note that the first line of code in the function is an if statement, telling the app to only do this if input$show_data is TRUE. We also specify some other arguments to datatable(), mostly for cosmetic reasons.
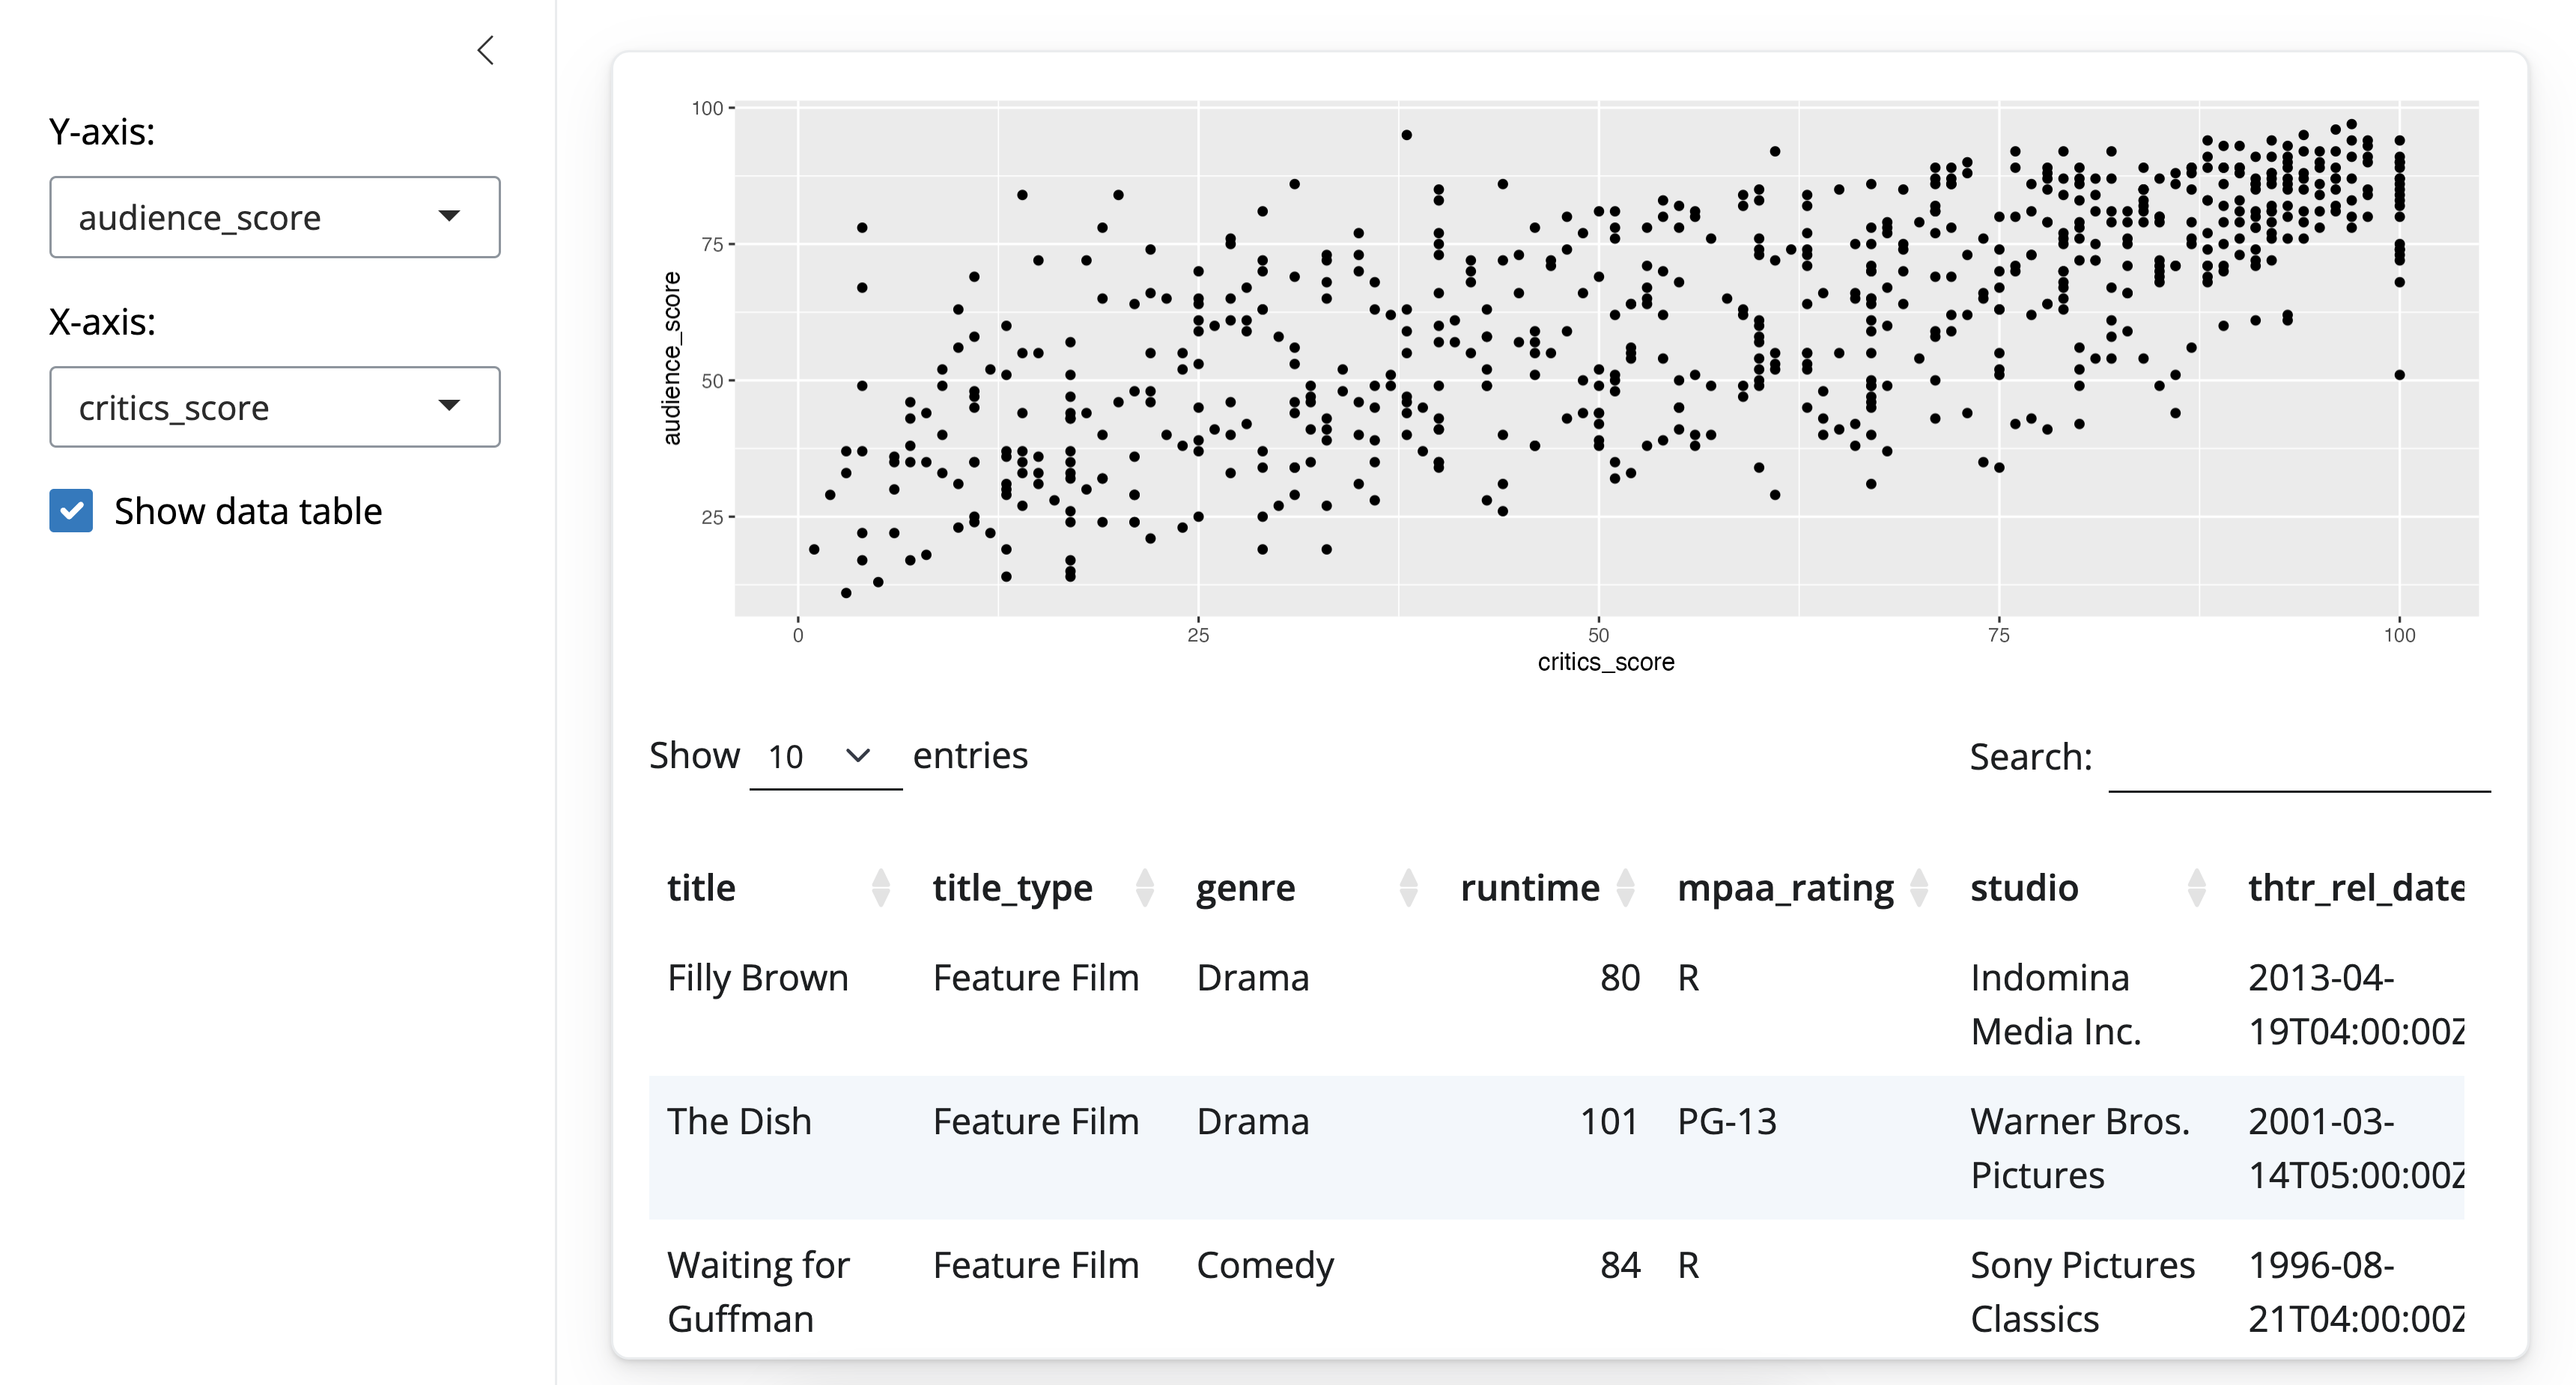
Here is the resulting app, with the box checked:
and box unchecked:
Scoping
A quick note on scoping:
We saw that the data loaded on top of the Shiny app, outside of ui and server definitions, is visible to the server. That’s how we were able to plot the data simply by referring to the data frame by name. The data frame is actually also visible to the UI as well. So our UI inputs could be defined programmatically.
We’ll give an example for this, not with an interactive widget but instead with a static HTML statement:
# Display number of observations
HTML(paste0("The dataset has ", nrow(movies),
            "observations."))
Practice: Add numericInput
The app below allows users to randomly select a desired number of movies, and displays some information on the selected movies in a tabular output. This table is created using a new function, renderDataTable(), but for now we will keep our focus on the numericInput() widget. We will also learn to define variables outside of the app so that they can be used in multiple spots to make our code more efficient.
Your turn
Make sure entries in the
sidebar()are separated by commasCalculate
n_total(total number of movies in the data set) asnrow(movies)before defining the UI.Use
n_totalinstead of the hard-coded"651"in the helper text.Add
minandmaxvalues to thenumericInput()widget, where min is 1 and max isn_total.Change the default
valueof the sample size to 30.Change the
stepparameter ofnumericInput()such that values increase by 1 (instead of 10) when the up arrow is clicked in the numeric input widget in the app UI.
Complete the exercise by navigating to the RStudio Cloud Project titled 2-2a Add numericInput in your Posit Cloud Workspace
- Copy the code below into an R script
# Load packages ----------------------------------------------------------------

library(shiny)
library(bslib)
library(ggplot2)
library(dplyr)
library(DT)

# Load data --------------------------------------------------------------------

load("movies.RData")

# Define UI --------------------------------------------------------------------

ui <- page_sidebar(

    sidebar = sidebar(

      HTML(paste("Enter a value between 1 and", "651"))

      numericInput(inputId = "n",
                   value = 3,
                   step = 10)

    ),

    card(
      DT::dataTableOutput(outputId = "moviestable")
    )
)

# Define server ----------------------------------------------------------------

server <- function(input, output, session) {

  output$moviestable <- DT::renderDataTable({
    movies_sample <- movies %>%
      sample_n(input$n) %>%
      select(title:studio)
    DT::datatable(data = movies_sample,
                  options = list(pageLength = 10),
                  rownames = FALSE)
  })

}

# Create the Shiny app object --------------------------------------------------

shinyApp(ui = ui, server = server)# Load packages ----------------------------------------------------------------
library(shiny)
library(bslib)
library(ggplot2)
library(dplyr)
library(DT)
# Load data --------------------------------------------------------------------
load("movies.RData")
n_total <- nrow(movies)
# Define UI --------------------------------------------------------------------
ui <- page_sidebar(
sidebar = sidebar(
HTML(paste("Enter a value between 1 and", n_total)),
numericInput(
inputId = "n",
label = "Sample size:",
value = 30,
min = 1, max = n_total,
step = 1
)
),
card(
dataTableOutput(outputId = "moviestable")
)
)
# Define server ----------------------------------------------------------------
server <- function(input, output, session) {
output$moviestable <- renderDataTable({
movies_sample <- movies %>%
sample_n(input$n) %>%
select(title:studio)
DT::datatable(
data = movies_sample,
options = list(pageLength = 10),
rownames = FALSE
)
})
}
# Create a Shiny app object ----------------------------------------------------
shinyApp(ui = ui, server = server)Practice: req
The app below is the one you developed in the previous exercise.
- Highlight the code and run it.
- Then, delete the numeric value.
You will encounter an error: Error: size is not a numeric or integer vector.
In order to avoid such errors, which users of your app could very easily encounter, we need to hold back the output from being calculated if the input is missing.
The req() function is the simplest and best way to do this, it ensures that values are available (“truthy”) before proceeding with a calculation or action. If any of the given values is not truthy, the operation is stopped by raising a “silent” exception (not logged by Shiny, nor displayed in the Shiny app’s UI).
Your turn
Add
req(input$n)in therenderDataTable()function in the server beforemovies_sampleis calculated.Run your app again and delete the input sample size to confirm that the error doesn’t appear, and neither does the output table.
Complete the exercise by navigating to the RStudio Cloud Project titled 2-2b req in your Posit Cloud Workspace
- Copy the code below into an R script
# Load packages ----------------------------------------------------------------

library(shiny)
library(bslib)
library(ggplot2)
options("shiny.sanitize.errors" = FALSE) # Turn off error sanitization

# Load data --------------------------------------------------------------------

load("movies.RData")
n_total <- nrow(movies)

# Define UI --------------------------------------------------------------------

ui <- page_sidebar(

    sidebar = sidebar(

      HTML(paste("Enter a value between 1 and", n_total)),

      numericInput(inputId = "n",
                   label = "Sample size:",
                   value = 30,
                   min = 1, max = n_total,
                   step = 1)

    ),

    card(
      DT::dataTableOutput(outputId = "moviestable")
    )
)

# Define server ----------------------------------------------------------------

server <- function(input, output, session) {

  output$moviestable <- DT::renderDataTable({
    movies_sample <- movies %>%
      sample_n(input$n) %>%
      select(title:studio)
    datatable(data = movies_sample,
              options = list(pageLength = 10),
              rownames = FALSE)
  })

}

# Create a Shiny app object ----------------------------------------------------

shinyApp(ui = ui, server = server)# Load packages ----------------------------------------------------------------
library(shiny)
library(bslib)
library(ggplot2)
options("shiny.sanitize.errors" = FALSE) # Turn off error sanitization
# Load data --------------------------------------------------------------------
load("movies.RData")
n_total <- nrow(movies)
# Define UI --------------------------------------------------------------------
ui <- page_sidebar(
sidebar = sidebar(
HTML(paste("Enter a value between 1 and", n_total)),
numericInput(
inputId = "n",
label = "Sample size:",
value = 30,
min = 1, max = n_total,
step = 1
)
),
card(
dataTableOutput(outputId = "moviestable")
)
)
# Define server ----------------------------------------------------------------
server <- function(input, output, session) {
output$moviestable <- renderDataTable({
req(input$n)
movies_sample <- movies %>%
sample_n(input$n) %>%
select(title:studio)
datatable(
data = movies_sample,
options = list(pageLength = 10),
rownames = FALSE
)
})
}
# Create a Shiny app object ----------------------------------------------------
shinyApp(ui = ui, server = server)Practice: Select to selectize
The app below can be used to display movies from selected studios. Currently you can only choose one studio, but we’ll modify it to allow for multiple selections. Additionally, there are 211 unique studios represented in this dataset, we need a better way to select than to scroll through such a long list, and we address that with the selectize option, which will suggest names of studios as you type them.
Your turn
View the help function for the
selectInputwidget by typing?selectInputin the console, and figure out how to enable theselectizeandmultipleselection options (or whether they are enabled by default).Based on your findings add the necessary arguments to the
selectInputwidget.Add a call to the
req()function in the server, just like you did in the previous exercise but this timerequiring thatinput$studiobe available.Run the app and (1) confirm that you can select multiple studios, (2) start typing “Warner Bros” to confirm
selectizeworks, and (3) delete all selections to confirmreqis preventing an error from being displayed.Now try with
selectize = FALSE: Start typing “Warner Bros” and see how the behaviour changed.
Complete the exercise by navigating to the RStudio Cloud Project titled 2-2c Select to selectize in your Posit Cloud Workspace
- Copy the code below into an R script
# Load packages ----------------------------------------------------------------

library(shiny)
library(bslib)
library(ggplot2)
library(dplyr)
library(DT)

# Load data --------------------------------------------------------------------

load("movies.RData")
all_studios <- sort(unique(movies$studio))

# Define UI --------------------------------------------------------------------

ui <- page_sidebar(

    sidebar = sidebar(
      selectInput(inputId = "studio",
                  label = "Select studio:",
                  choices = all_studios,
                  selected = "20th Century Fox")

    ),

    card(
      DT::dataTableOutput(outputId = "moviestable")
    )
)

# Define server ----------------------------------------------------------------

server <- function(input, output, session) {

  output$moviestable <- renderDataTable({
    movies_from_selected_studios <- movies %>%
      filter(studio == input$studio) %>%
      select(title:studio)
    DT::datatable(data = movies_from_selected_studios,
              options = list(pageLength = 10),
              rownames = FALSE)
  })

}

# Create a Shiny app object ----------------------------------------------------
shinyApp(ui = ui, server = server)# Load packages ----------------------------------------------------------------
library(shiny)
library(bslib)
library(ggplot2)
library(dplyr)
library(DT)
# Load data --------------------------------------------------------------------
load("movies.RData")
all_studios <- sort(unique(movies$studio))
# Define UI --------------------------------------------------------------------
ui <- page_sidebar(
# Input(s)
sidebar = sidebar(
selectInput(
inputId = "studio",
label = "Select studio:",
choices = all_studios,
selected = "20th Century Fox",
multiple = TRUE
)
),
# Output(s)
card(
dataTableOutput(outputId = "moviestable")
)
)
# Server
server <- function(input, output, session) {
# Create data table
output$moviestable <- renderDataTable({
req(input$studio)
movies_from_selected_studios <- movies %>%
filter(studio %in% input$studio) %>%
select(title:studio)
DT::datatable(
data = movies_from_selected_studios,
options = list(pageLength = 10),
rownames = FALSE
)
})
}
# Create a Shiny app object ----------------------------------------------------
shinyApp(ui = ui, server = server)Practice: Convert dateInput to dateRangeInput
The app below can be used to display movies from a particular date onwards. Instead we would like to select movies between two given dates. Hence we need to convert the dateInput widget to dateRangeInput. This input will yield a vector (input$date) of length two: the first element is the start date and the second is the end date.
Your turn
Review the help files for the two widgets by typing
?dateInputand?dateRangeInputin the console.Update
dateInputtodateRangeInput, instead of just a start date (value) specifystartandenddates, Jan 1, 2013 and Jan 1, 2014, respectively.Update the explanatory text to reflect the new functionality of the app.
Change the
startviewto"year"to make it a bit easier for the user to navigate the calendar.Update how subsetting is being done in the server function: we need movies released at or after the start date and at or before the end date.
Add the necessary
reqstatement to the server to stop the app from trying to create a plot when no dates are specified.
Complete the exercise by navigating to the RStudio Cloud Project titled 2-2d Convert dateInput to dateRangeInput in your Posit Cloud Workspace
- Copy the code below into an R script
# Load packages ----------------------------------------------------------------

library(shiny)
library(bslib)
library(ggplot2)
library(dplyr)

# Load data --------------------------------------------------------------------

load("movies.RData")
min_date <- min(movies$thtr_rel_date)
max_date <- max(movies$thtr_rel_date)

# Define UI --------------------------------------------------------------------

ui <- page_sidebar(

    sidebar = sidebar(

      HTML(paste0("Movies released since the following date will be plotted.
                 Pick a date between ", min_date, " and ", max_date, ".")),

      br(), br(),

      dateInput(inputId = "date",
                label = "Select date:",
                value = "2013-01-01",
                min = min_date, max = max_date)
    ),

    card(
      plotOutput(outputId = "scatterplot")
    )
)

# Define server ----------------------------------------------------------------

server <- function(input, output, session) {

  output$scatterplot <- renderPlot({
    movies_selected_date <- movies %>%
      filter(thtr_rel_date >= as.POSIXct(input$date))
    ggplot(data = movies_selected_date, aes(x = critics_score, y = audience_score, color = mpaa_rating)) +
      geom_point()
  })

}

# Create a Shiny app object ----------------------------------------------------

shinyApp(ui = ui, server = server)# Load packages ----------------------------------------------------------------
library(shiny)
library(bslib)
library(ggplot2)
library(dplyr)
# Load data --------------------------------------------------------------------
load("movies.RData")
min_date <- min(movies$thtr_rel_date)
max_date <- max(movies$thtr_rel_date)
# Define UI --------------------------------------------------------------------
ui <- page_sidebar(
sidebar = sidebar(
HTML(paste0("Movies released between the following dates will be plotted.
Pick dates between ", min_date, " and ", max_date, ".")),
br(), br(),
dateRangeInput(
inputId = "date",
label = "Select dates:",
start = "2013-01-01", end = "2014-01-01",
min = min_date, max = max_date,
startview = "year"
)
),
card(
plotOutput(outputId = "scatterplot")
)
)
# Define server ----------------------------------------------------------------
server <- function(input, output, session) {
output$scatterplot <- renderPlot({
req(input$date)
movies_selected_date <- movies %>%
filter(thtr_rel_date >= as.POSIXct(input$date[1]) & thtr_rel_date <= as.POSIXct(input$date[2]))
ggplot(data = movies_selected_date, aes(x = critics_score, y = audience_score, color = mpaa_rating)) +
geom_point()
})
}
# Create a Shiny app object ----------------------------------------------------
shinyApp(ui = ui, server = server)