UI Outputs
We’ve seen UI outputs before, and in this section we dive deeper into the plotOutput() function to build an interactive graph.
Once again we’re going to start with this app.
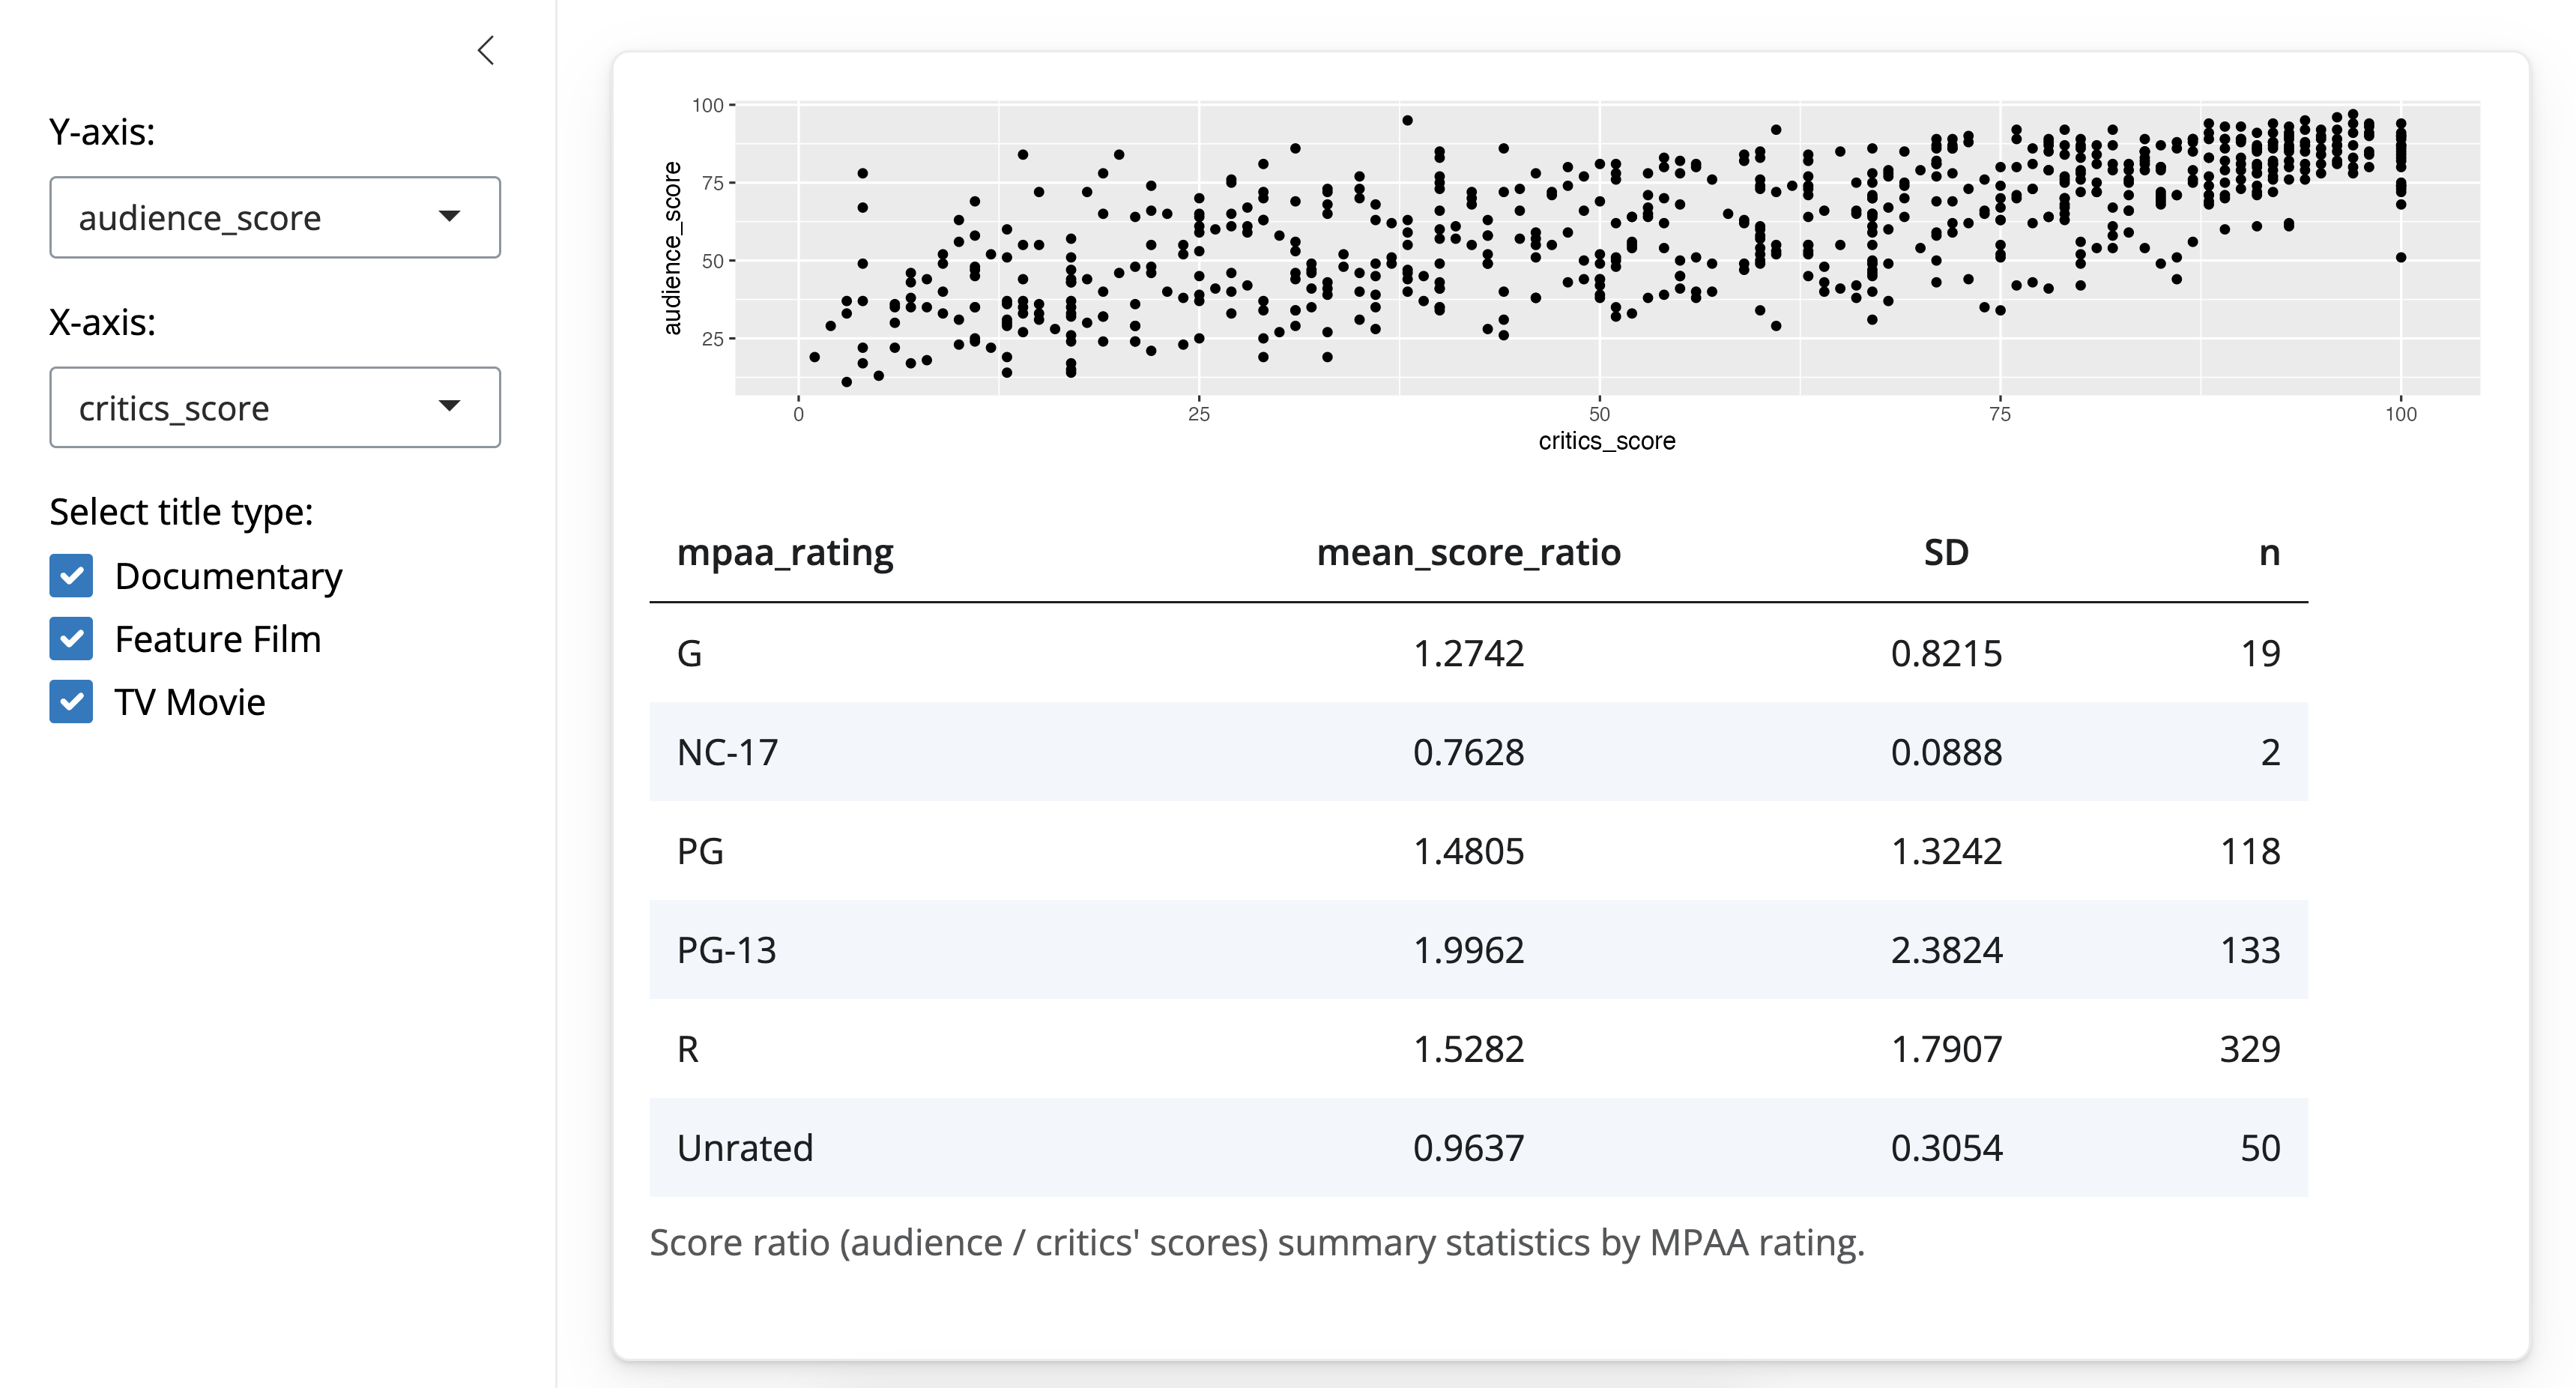
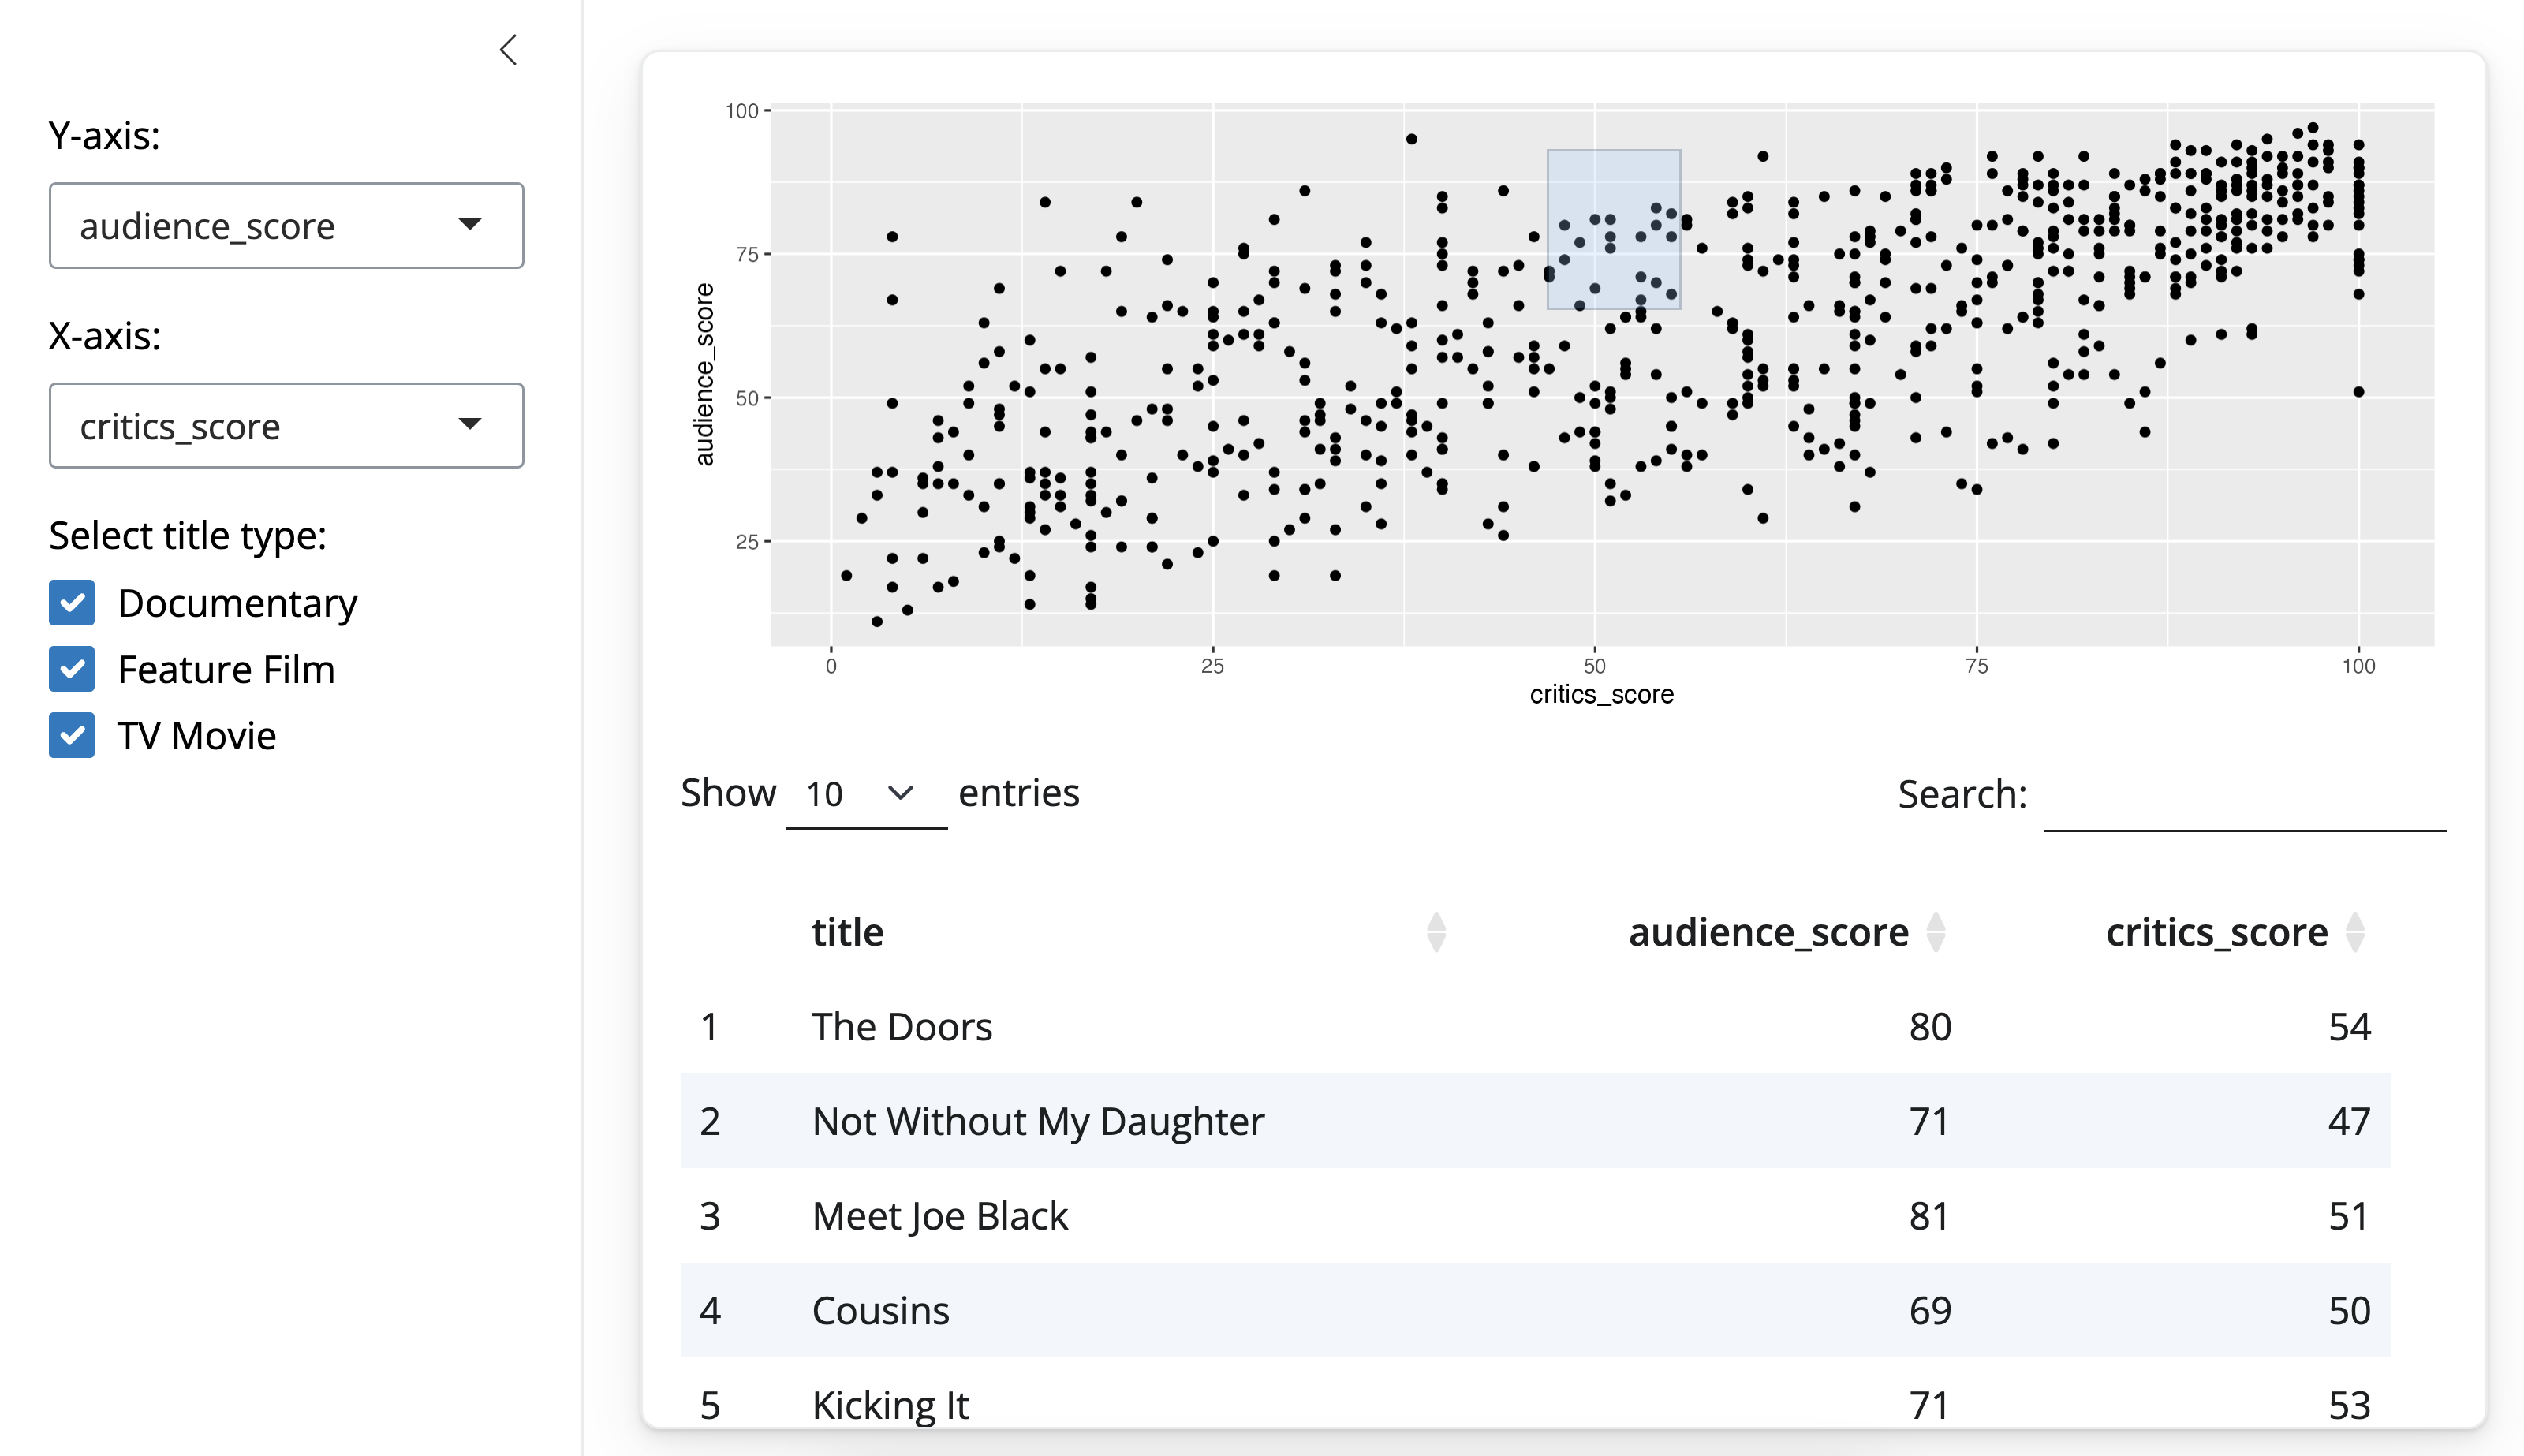
And we’ll add functionality to the app so that movies corresponding to the selected points on the plot via brushing are displayed in a data table beneath the plot.
plotOutput()
We need to make three modifications to our app to accomplish this.
- ui: Add functionality to
plotOutputto select points via brushing. - ui: Add an output defining where the data table should appear.
- server: Add a reactive expression that creates the data table for the selected points.
Let’s go through these steps one by one.
1. ui: Add functionality to plotOutput to select points via brushing.
First is the brushing capability added to the plotOutput() function. Previously we’ve only passed one argument to the plotOutput() function. This time we’re making use of its additional arguments, one of which is brush.
# Show scatterplot with brushing capability
plotOutput(outputId = "scatterplot", brush = "plot_brush")
Providing a string to this argument allows the user to “brush” in the plotting area. Brushing means that the user will be able to draw a rectangle in the plotting area and drag it around. Brushing will send information about the brushed area to the server. The value will then be accessible via input$plot_brush.
2. ui: Add an output defining where the data table should appear.
Second, we use the dataTableOutput() to define where on the main panel the data table should appear.
 # Show data table
dataTableOutput(outputId = "moviestable")
3. server: Add a reactive expression that creates the data table for the selected points.
And third, in the server, we describe how this table should be calculated with the renderDataTable() function. We make use of a helper function brushedPoints(), which returns rows from a data frame which are under a brush used with plotOutput().
# Print data table
output$moviestable <- renderDataTable({
  brushedPoints(movies, input$plot_brush) %>%
    select(title, audience_score, critics_score)
})- The first argument is the data frame from which to select rows.
- The second argument is the input element that contains information on the brushed points.
- In order to avoid printing all of the variables in the data frame, in the next line we select a few to display.
Note that the complete expression is wrapped in curly braces again. We do this for consistency in our code as well as to make debugging easier, if need be.
Practice - Hovering
In addition to brushing, users can also interact with plots via hovering over them.
Your turn
Change the
brushargument tohoverin theplotOutput().Read the article on Selecting rows of data to determine what change needs to be made in the
renderDataTable()function to list the data points that the user hovers on.Implement this change.
Complete the exercise by navigating to the RStudio Cloud Project titled 2-4a Hovering in your Posit Cloud Workspace.
- Copy the code below into an R script
# Load packages ----------------------------------------------------------------

library(shiny)
library(bslib)
library(ggplot2)
library(dplyr)

# Load data --------------------------------------------------------------------

load("movies.RData")

# Define UI --------------------------------------------------------------------

ui <- page_sidebar(

    sidebar = sidebar(
      selectInput(
        inputId = "y", label = "Y-axis:",
        choices = c("imdb_rating", "imdb_num_votes", "critics_score", "audience_score", "runtime"),
        selected = "audience_score"
      ),

      selectInput(
        inputId = "x", label = "X-axis:",
        choices = c("imdb_rating", "imdb_num_votes", "critics_score", "audience_score", "runtime"),
        selected = "critics_score"
      )
    ),

    card(
      plotOutput(outputId = "scatterplot", brush = "plot_brush"),
      DT::dataTableOutput(outputId = "moviestable")
    )
)

# Define server ----------------------------------------------------------------

server <- function(input, output, session) {

  output$scatterplot <- renderPlot({
    ggplot(data = movies, aes_string(x = input$x, y = input$y)) +
      geom_point()
  })

  output$moviestable <- renderDataTable({
    brushedPoints(movies, brush = input$plot_brush) %>%
      select(title, audience_score, critics_score)
  })
}

# Create the Shiny app object --------------------------------------------------

shinyApp(ui = ui, server = server)# Load packages ----------------------------------------------------------------
library(shiny)
library(bslib)
library(ggplot2)
library(dplyr)
# Load data --------------------------------------------------------------------
load("movies.RData")
# Define UI --------------------------------------------------------------------
ui <- page_sidebar(
sidebar = sidebar(
selectInput(
inputId = "y", label = "Y-axis:",
choices = c("imdb_rating", "imdb_num_votes", "critics_score", "audience_score", "runtime"),
selected = "audience_score"
),
selectInput(
inputId = "x", label = "X-axis:",
choices = c("imdb_rating", "imdb_num_votes", "critics_score", "audience_score", "runtime"),
selected = "critics_score"
)
),
card(
plotOutput(outputId = "scatterplot", hover = "plot_hover"),
dataTableOutput(outputId = "moviestable")
)
)
# Define server ----------------------------------------------------------------
server <- function(input, output, session) {
output$scatterplot <- renderPlot({
ggplot(data = movies, aes_string(x = input$x, y = input$y)) +
geom_point()
})
output$moviestable <- renderDataTable({
nearPoints(movies, input$plot_hover) %>%
select(title, audience_score, critics_score)
})
}
# Create the Shiny app object --------------------------------------------------
shinyApp(ui = ui, server = server)Practice - Displaying text outputs
The goal in this exercise is to develop an app where the user selects two variables and their relationship is visualized with a scatterplot, and averages of both variables are reported as well as the output of the linear regression predicting the variable on the y-axis from the variable in the x-axis. The code on the right only does some of these things.
Your turn
Add the appropriate output UI functions and output IDs to print the elements noted in the comments in the main content area of the UI and run the app. Also add commas as needed.
In the server function averages are calculated first and then the regression model is fit, but in the app the regression output comes before the averages. Make the necessary changes to the app so that averages are displayed above the regression output.
Complete the exercise by navigating to the RStudio Cloud Project titled 2-4b Displaying text outputs in your Posit Cloud Workspace.
- Copy the code below into an R script
# Load packages ----------------------------------------------------------------

library(shiny)
library(bslib)
library(ggplot2)
library(dplyr)

# Load data --------------------------------------------------------------------

load("movies.RData")

# Define UI --------------------------------------------------------------------

ui <- page_sidebar(

    sidebar = sidebar(

      selectInput(inputId = "y",
                  label = "Y-axis:",
                  choices = c("imdb_rating", "imdb_num_votes", "critics_score", "audience_score", "runtime"),
                  selected = "audience_score"),

      selectInput(inputId = "x",
                  label = "X-axis:",
                  choices = c("imdb_rating", "imdb_num_votes", "critics_score", "audience_score", "runtime"),
                  selected = "critics_score")

    ),

    card(
      plotOutput(outputId = "scatterplot"),
      ___(outputId = ___) # regression output
      ___(outputId = ___) # avg of x
      ___(outputId = ___) # avg of y

    )
)
# Define server ----------------------------------------------------------------

server <- function(input, output, session) {

  output$scatterplot <- renderPlot({
    ggplot(data = movies, aes_string(x = input$x, y = input$y)) +
      geom_point()
  })

  output$avg_x <- renderText({
    avg_x <- movies %>% pull(input$x) %>% mean() %>% round(2)
    paste("Average", input$x, "=", avg_x)
  })

  output$avg_y <- renderText({
    avg_y <- movies %>% pull(input$y) %>% mean() %>% round(2)
    paste("Average", input$y, "=", avg_y)
  })

  output$lmoutput <- renderPrint({
    x <- movies %>% pull(input$x)
    y <- movies %>% pull(input$y)
    summ <- summary(lm(y ~ x, data = movies))
    print(summ, digits = 3, signif.stars = FALSE)
  })

  }

# Create the Shiny app object --------------------------------------------------

shinyApp(ui = ui, server = server)# Load packages ----------------------------------------------------------------
library(shiny)
library(bslib)
library(ggplot2)
library(dplyr)
# Load data --------------------------------------------------------------------
load("movies.RData")
# Define UI --------------------------------------------------------------------
ui <- page_sidebar(
sidebar = sidebar(
selectInput(inputId = "y",
label = "Y-axis:",
choices = c("imdb_rating", "imdb_num_votes", "critics_score", "audience_score", "runtime"),
selected = "audience_score"),
selectInput(inputId = "x",
label = "X-axis:",
choices = c("imdb_rating", "imdb_num_votes", "critics_score", "audience_score", "runtime"),
selected = "critics_score")
),
# Output(s)
card(
plotOutput(outputId = "scatterplot"),
textOutput(outputId = "avg_x"), # avg of x
textOutput(outputId = "avg_y"), # avg of y
verbatimTextOutput(outputId = "lmoutput") # regression output
)
)
# Define server ----------------------------------------------------------------
server <- function(input, output, session) {
output$scatterplot <- renderPlot({
ggplot(data = movies, aes_string(x = input$x, y = input$y)) +
geom_point()
})
output$avg_x <- renderText({
avg_x <- movies %>% pull(input$x) %>% mean() %>% round(2)
paste("Average", input$x, "=", avg_x)
})
output$avg_y <- renderText({
avg_y <- movies %>% pull(input$y) %>% mean() %>% round(2)
paste("Average", input$y, "=", avg_y)
})
output$lmoutput <- renderPrint({
x <- movies %>% pull(input$x)
y <- movies %>% pull(input$y)
print(summary(lm(y ~ x, data = movies)), digits = 3, signif.stars = FALSE)
})
}
# Create the Shiny app object --------------------------------------------------
shinyApp(ui = ui, server = server)Practice - Creating and formatting HTML output
In the previous exercise you developed an app that reported averages of selected x and y variables as two separate outputs. An alternative approach would be to combine them into a single, multi-line output.
Combine the values calculated in the previous exercise as described below to create a customized HTML output.
Your turn
In the server, create a new output, named
output$avgs, that replacesoutput$avg_xandoutput$avg_y. For this output, calculateavg_xandavg_ylike you did before, save the output text strings asstr_xandstr_y, and finally combine these two text strings withHTML(paste(str_x, str_y, sep = '<br/>')).In the UI, replace the
textOutput()s with a call tohtmlOutput(), calling the new HTML text string you created in the server.
Complete the exercise by navigating to the RStudio Cloud Project titled 2-4c Creating and formatting HTML output in your Posit Cloud Workspace.
- Copy the code below into an R script
# Load packages ----------------------------------------------------------------

library(shiny)
library(bslib)
library(ggplot2)
library(dplyr)

# Load data --------------------------------------------------------------------

load("movies.RData")

# Define UI --------------------------------------------------------------------

ui <- page_sidebar(

    sidebar = sidebar(
      selectInput(inputId = "y",
                  label = "Y-axis:",
                  choices = c("imdb_rating", "imdb_num_votes", "critics_score", "audience_score", "runtime"),
                  selected = "audience_score"),

      selectInput(inputId = "x",
                  label = "X-axis:",
                  choices = c("imdb_rating", "imdb_num_votes", "critics_score", "audience_score", "runtime"),
                  selected = "critics_score")

    ),

    card(
      plotOutput(outputId = "scatterplot"),
      textOutput(outputId = "avg_x"), # avg of x
      textOutput(outputId = "avg_y"), # avg of y
      verbatimTextOutput(outputId = "lmoutput") # regression output
    )
)

# Define server ----------------------------------------------------------------

server <- function(input, output, session) {

  output$scatterplot <- renderPlot({
    ggplot(data = movies, aes_string(x = input$x, y = input$y)) +
      geom_point()
  })

  output$avg_x <- renderText({
    avg_x <- movies %>% pull(input$x) %>% mean() %>% round(2)
    paste("Average", input$x, "=", avg_x)
  })

  output$avg_y <- renderText({
    avg_y <- movies %>% pull(input$y) %>% mean() %>% round(2)
    paste("Average", input$y, "=", avg_y)
  })

  output$lmoutput <- renderPrint({
    x <- movies %>% pull(input$x)
    y <- movies %>% pull(input$y)
    print(summary(lm(y ~ x, data = movies)), digits = 3, signif.stars = FALSE)
  })

}

# Create the Shiny app object --------------------------------------------------

shinyApp(ui = ui, server = server)# Load packages ----------------------------------------------------------------
library(shiny)
library(bslib)
library(ggplot2)
library(dplyr)
# Load data --------------------------------------------------------------------
load("movies.RData")
# Define UI --------------------------------------------------------------------
ui <- page_sidebar(
sidebar = sidebar(
selectInput(inputId = "y",
label = "Y-axis:",
choices = c("imdb_rating", "imdb_num_votes", "critics_score", "audience_score", "runtime"),
selected = "audience_score"),
selectInput(inputId = "x",
label = "X-axis:",
choices = c("imdb_rating", "imdb_num_votes", "critics_score", "audience_score", "runtime"),
selected = "critics_score")
),
card(
plotOutput(outputId = "scatterplot"),
htmlOutput(outputId = "avgs"),
verbatimTextOutput(outputId = "lmoutput")
)
)
# Define server ----------------------------------------------------------------
server <- function(input, output, session) {
output$scatterplot <- renderPlot({
ggplot(data = movies, aes_string(x = input$x, y = input$y)) +
geom_point()
})
output$avgs <- renderUI({
avg_x <- movies %>% pull(input$x) %>% mean() %>% round(2)
avg_y <- movies %>% pull(input$y) %>% mean() %>% round(2)
str_x <- paste("Average", input$x, "=", avg_x)
str_y <- paste("Average", input$y, "=", avg_y)
HTML(paste(str_x, str_y, sep = '<br/>'))
})
output$lmoutput <- renderPrint({
x <- movies %>% pull(input$x)
y <- movies %>% pull(input$y)
print(summary(lm(y ~ x, data = movies)), digits = 3, signif.stars = FALSE)
})
}
# Create the Shiny app object --------------------------------------------------
shinyApp(ui = ui, server = server)