Using Reactives
In this section we discuss why we use reactives.
Why use reactives?
In the previous exercises we were able to reuse our subsetted data frame in multiple places in the server after defining it once as a reactive expression.
In general, reactive expressions help you avoid copy-and-paste code and let you not repeat yourself, and they also help decompose large and complex calculations into smaller pieces.
These benefits are similar to what happens when you decompose a large complex R script into a series of small functions that build on each other
Functions vs. reactives
While functions and reactives help accomplish similar goals in terms of not-repeating oneself, they’re different in implementation.
Each time you call a function, R will evaluate it.
However reactive expressions are lazy, they only get executed when their input changes. This means that even if you call a reactive expression multiple times in your app, it will only re-execute when its inputs change.
Reactlog
Using many reactive expressions in your app can create a complicated dependency structure in your app.
The reactlog is a graphical representation of this dependency structure, and it also gives you very detailed information about what’s happening under the hood as Shiny evaluates your application.
To view the reactlog:
- Start a fresh R session, and run
options(shiny.reactlog = TRUE) - Then launch your app as you normally would
- and in the app press
Ctrl + F3(or on a Mac:Cmd + F3).
The reactlog for the app we developed in the previous section looks like this. It uses the icons for reactive inputs, expressions, and outputs that we saw earlier in the course.
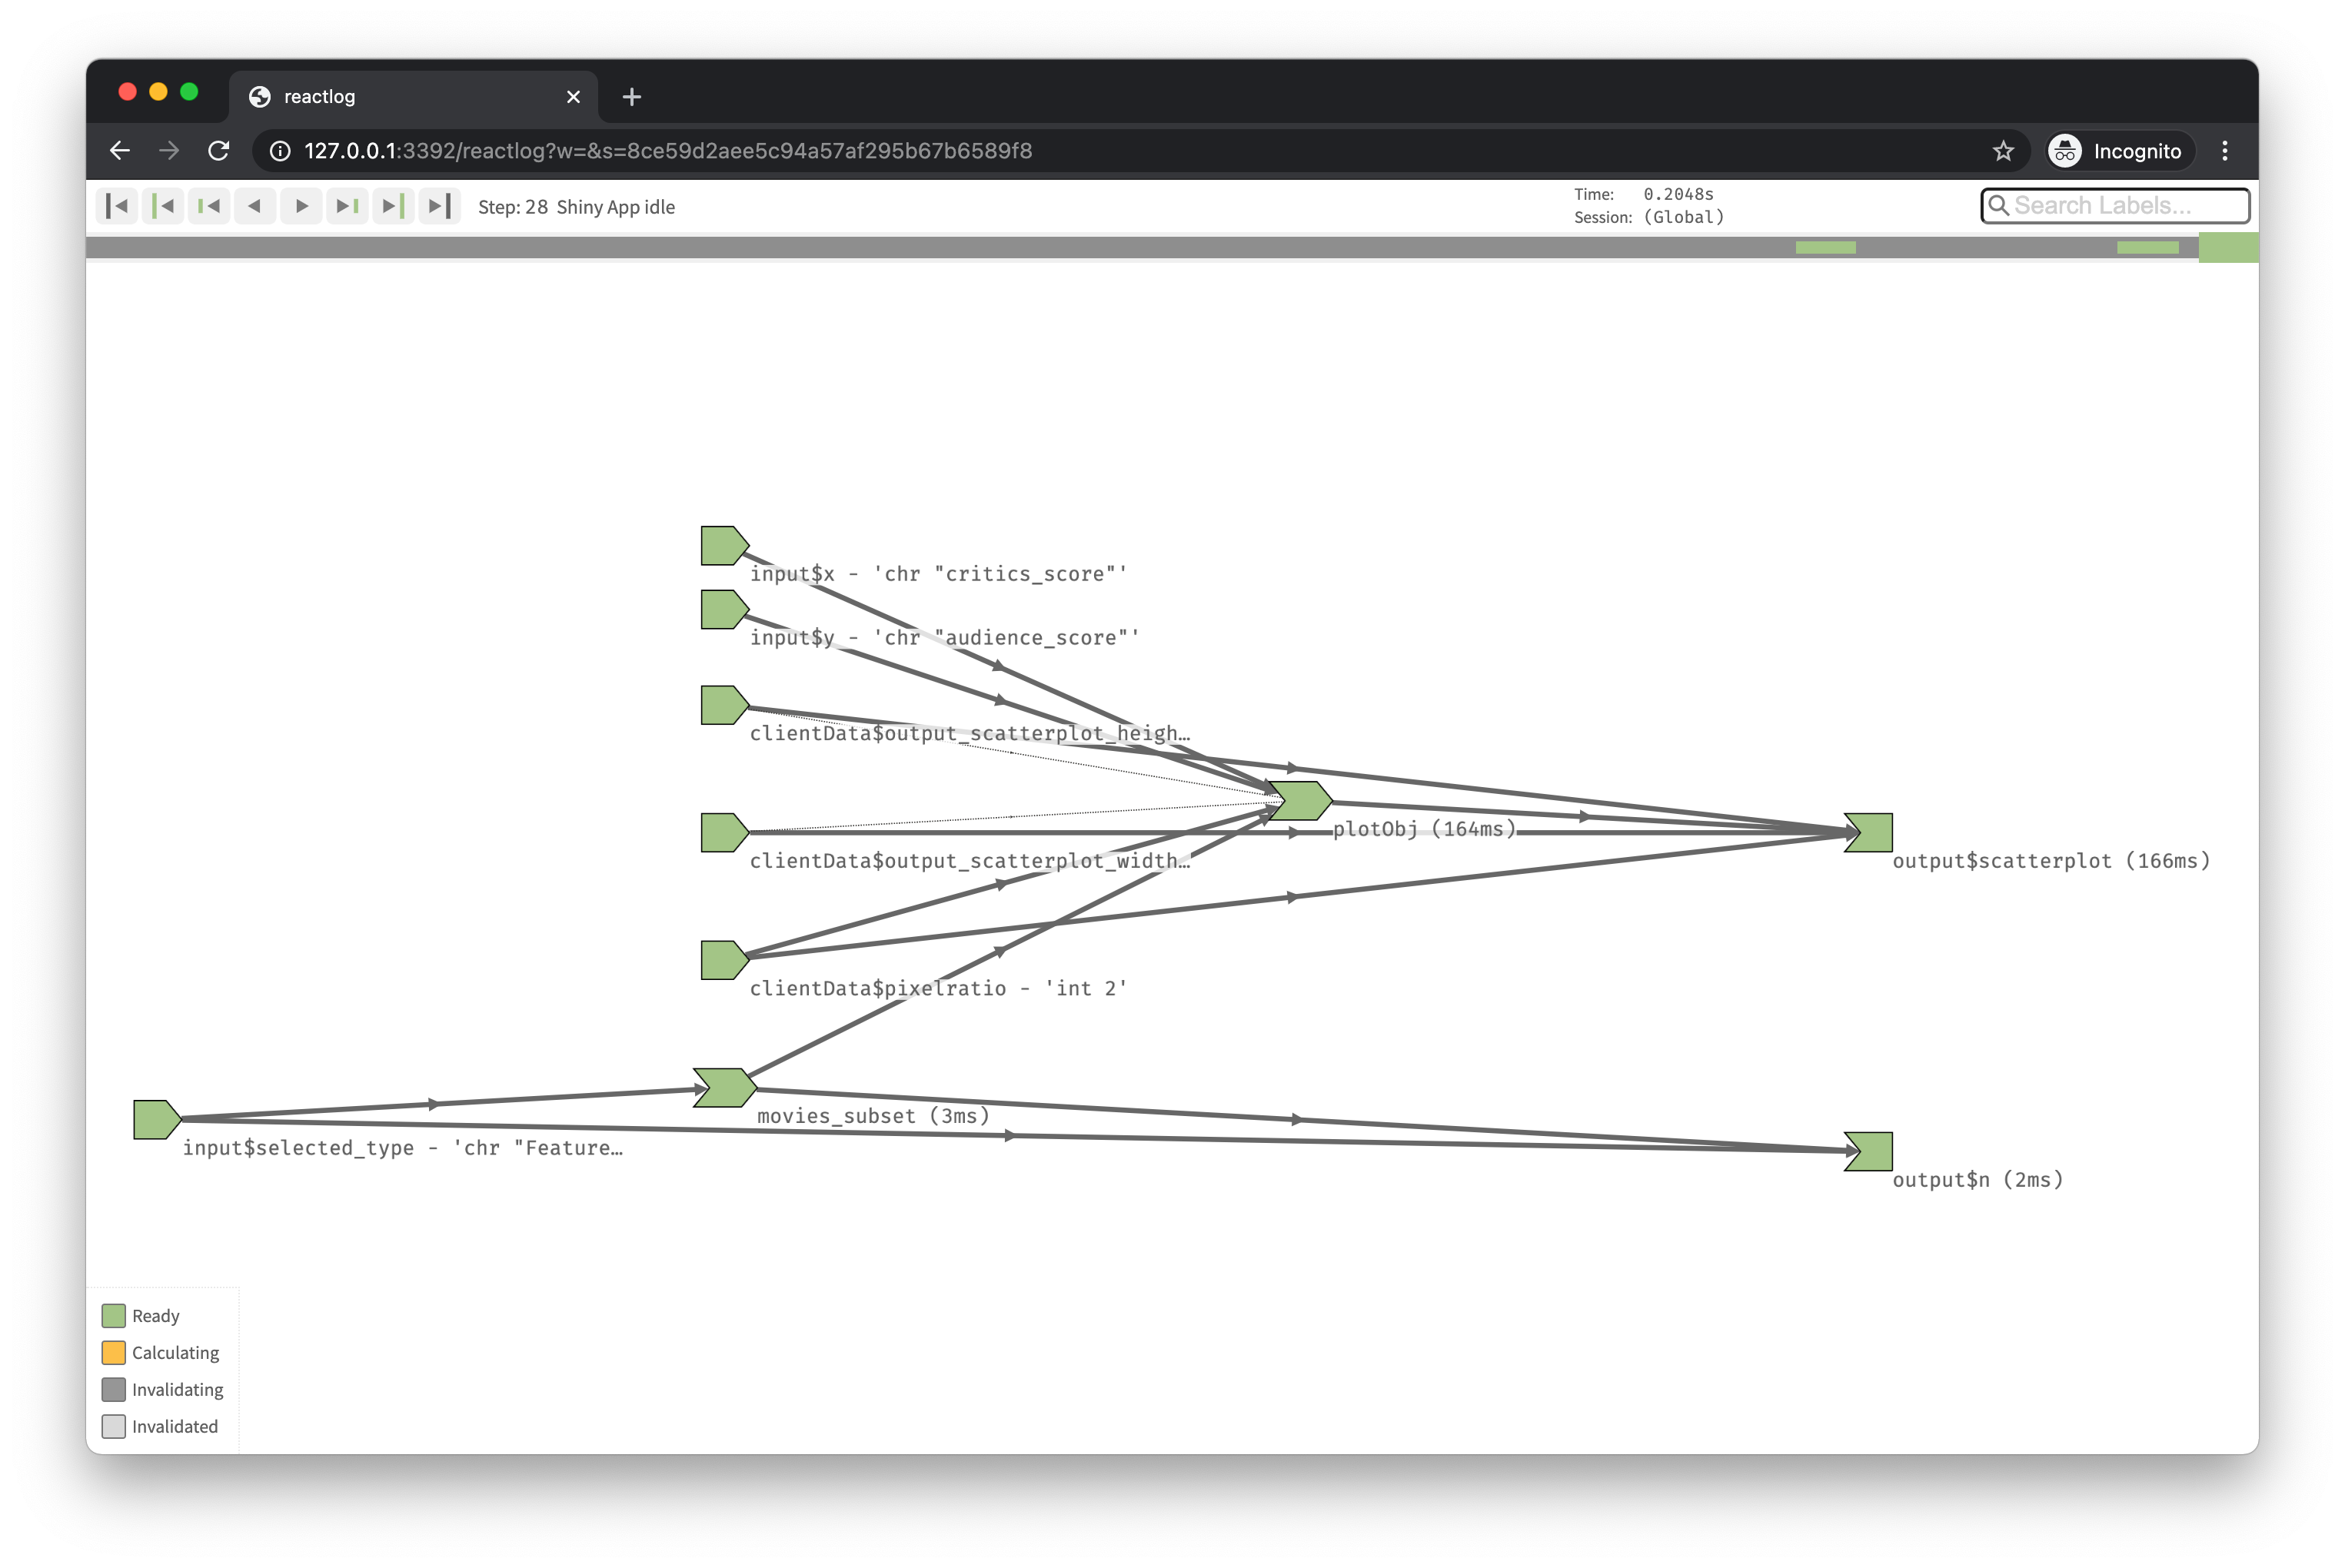
- Outputs are at the end of the reactive flow.
- Inputs are at the beginning.
movies_subset()is a reactive expression in between the input and the outputs.
This visualization also makes it easy to view the inputs the reactive expression depends on and the output that depend on it.
Practice - Find missing reactives
In the following app code there are a number of spots where reactives are not used properly.
Your turn
- Debug the app, making sure reactives are being used correctly.
Complete the exercise by navigating to the Posit Cloud Project titled 3-2a Find missing reactives in your Posit Cloud Workspace
# Load packages ----------------------------------------------------------------

library(shiny)
library(bslib)
library(ggplot2)
library(dplyr)
library(tools)

# Load data --------------------------------------------------------------------

load("movies.RData")

# Define UI --------------------------------------------------------------------

ui <- page_sidebar(
  title = "Movie browser",
  sidebar = sidebar(
      selectInput(
        inputId = "y",
        label = "Y-axis:",
        choices = c(
          "IMDB rating" = "imdb_rating",
          "IMDB number of votes" = "imdb_num_votes",
          "Critics Score" = "critics_score",
          "Audience Score" = "audience_score",
          "Runtime" = "runtime"
        ),
        selected = "audience_score"
      ),

      selectInput(
        inputId = "x",
        label = "X-axis:",
        choices = c(
          "IMDB rating" = "imdb_rating",
          "IMDB number of votes" = "imdb_num_votes",
          "Critics Score" = "critics_score",
          "Audience Score" = "audience_score",
          "Runtime" = "runtime"
        ),
        selected = "critics_score"
      ),

      selectInput(
        inputId = "z",
        label = "Color by:",
        choices = c(
          "Title Type" = "title_type",
          "Genre" = "genre",
          "MPAA Rating" = "mpaa_rating",
          "Critics Rating" = "critics_rating",
          "Audience Rating" = "audience_rating"
        ),
        selected = "mpaa_rating"
      ),

      textInput(
        inputId = "plot_title",
        label = "Plot title",
        placeholder = "Enter text for plot title"
      ),

      checkboxGroupInput(
        inputId = "selected_type",
        label = "Select movie type(s):",
        choices = c("Documentary", "Feature Film", "TV Movie"),
        selected = "Feature Film"
      )
    ),

    card(
      plotOutput(outputId = "scatterplot"),
      textOutput(outputId = "description")
    )
)

# Define server ----------------------------------------------------------------

server <- function(input, output, session) {

  # Create a subset of data filtering for selected title types
  movies_subset <- reactive({
    req(input$selected_type)
    filter(movies, title_type %in% input$selected_type)
  })

  # Convert plot_title toTitleCase
  output$pretty_plot_title <- toTitleCase(input$plot_title)

  # Create scatterplot object the plotOutput function is expecting
  output$scatterplot <- renderPlot({
    ggplot(
      data = movies_subset,
      aes_string(x = input$x, y = input$y, color = input$z)
    ) +
      geom_point() +
      labs(title = pretty_plot_title)
  })

  # Create descriptive text
  output$description <- renderText({
    paste0("The plot above titled '", pretty_plot_title, "' visualizes the relationship between ", input$x, " and ", input$y, ", conditional on ", input$z, ".")
  })
}

# Create the Shiny app object --------------------------------------------------

shinyApp(ui = ui, server = server)# Load packages ----------------------------------------------------------------
library(shiny)
library(bslib)
library(ggplot2)
library(dplyr)
library(tools)
# Load data --------------------------------------------------------------------
load("movies.RData")
# Define UI --------------------------------------------------------------------
ui <- page_sidebar(
title = "Movie browser",
sidebar = sidebar(
selectInput(
inputId = "y",
label = "Y-axis:",
choices = c(
"IMDB rating" = "imdb_rating",
"IMDB number of votes" = "imdb_num_votes",
"Critics Score" = "critics_score",
"Audience Score" = "audience_score",
"Runtime" = "runtime"
),
selected = "audience_score"
),
selectInput(
inputId = "x",
label = "X-axis:",
choices = c(
"IMDB rating" = "imdb_rating",
"IMDB number of votes" = "imdb_num_votes",
"Critics Score" = "critics_score",
"Audience Score" = "audience_score",
"Runtime" = "runtime"
),
selected = "critics_score"
),
selectInput(
inputId = "z",
label = "Color by:",
choices = c(
"Title Type" = "title_type",
"Genre" = "genre",
"MPAA Rating" = "mpaa_rating",
"Critics Rating" = "critics_rating",
"Audience Rating" = "audience_rating"
),
selected = "mpaa_rating"
),
textInput(
inputId = "plot_title",
label = "Plot title",
placeholder = "Enter text for plot title"
),
checkboxGroupInput(
inputId = "selected_type",
label = "Select movie type(s):",
choices = c("Documentary", "Feature Film", "TV Movie"),
selected = "Feature Film"
)
),
card(
plotOutput(outputId = "scatterplot"),
textOutput(outputId = "description")
)
)
# Define server ----------------------------------------------------------------
server <- function(input, output, session) {
# Create a subset of data filtering for selected title types
movies_subset <- reactive({
req(input$selected_type)
filter(movies, title_type %in% input$selected_type)
})
# Convert plot_title toTitleCase
pretty_plot_title <- reactive({
toTitleCase(input$plot_title)
})
# Create scatterplot object the plotOutput function is expecting
output$scatterplot <- renderPlot({
ggplot(
data = movies_subset(),
aes_string(x = input$x, y = input$y, color = input$z)
) +
geom_point() +
labs(title = pretty_plot_title())
})
# Create descriptive text
output$description <- renderText({
paste0("The plot above titled '", pretty_plot_title(), "' visualizes the relationship between ", input$x, " and ", input$y, ", conditional on ", input$z, ".")
})
}
# Create the Shiny app object --------------------------------------------------
shinyApp(ui = ui, server = server)Practice - Find inconsistencies in what the app is reporting
In this exercise we go on a hunt for mismatched used of reactives.
Your turn
- Run the sample code and view the app. Do the number of movies plotted match the number cited in the text below the app?
- If not, fix the app code.
Complete the exercise by navigating to the Posit Cloud Project titled 3-2b Find inconsistencies in what the app is reporting in your Posit Cloud Workspace
# Load packages ----------------------------------------------------------------

library(shiny)
library(bslib)
library(ggplot2)
library(dplyr)

# Load data --------------------------------------------------------------------

load("movies.RData")

# Define UI --------------------------------------------------------------------

ui <- page_sidebar(
    sidebar = sidebar(
      selectInput(
        inputId = "y",
        label = "Y-axis:",
        choices = c(
          "IMDB rating" = "imdb_rating",
          "IMDB number of votes" = "imdb_num_votes",
          "Critics Score" = "critics_score",
          "Audience Score" = "audience_score",
          "Runtime" = "runtime"
        ),
        selected = "audience_score"
      ),

      selectInput(
        inputId = "x",
        label = "X-axis:",
        choices = c(
          "IMDB rating" = "imdb_rating",
          "IMDB number of votes" = "imdb_num_votes",
          "Critics Score" = "critics_score",
          "Audience Score" = "audience_score",
          "Runtime" = "runtime"
        ),
        selected = "critics_score"
      ),

      selectInput(
        inputId = "z",
        label = "Color by:",
        choices = c(
          "Title Type" = "title_type",
          "Genre" = "genre",
          "MPAA Rating" = "mpaa_rating",
          "Critics Rating" = "critics_rating",
          "Audience Rating" = "audience_rating"
        ),
        selected = "mpaa_rating"
      ),

      checkboxGroupInput(
        inputId = "selected_type",
        label = "Select movie type(s):",
        choices = c("Documentary", "Feature Film", "TV Movie"),
        selected = "Feature Film"
      ),

      numericInput(
        inputId = "n_samp",
        label = "Sample size:",
        min = 1, max = nrow(movies),
        value = 3
      )
    ),

    card(
      plotOutput(outputId = "scatterplot"),
      uiOutput(outputId = "n")
    )
)

# Define server ----------------------------------------------------------------

server <- function(input, output, session) {

  # Create a subset of data filtering for selected title types
  movies_subset <- reactive({
    req(input$selected_type)
    filter(movies, title_type %in% input$selected_type)
  })

  # Create new df that is n_samp obs from selected type movies
  movies_sample <- reactive({
    req(input$n_samp)
    sample_n(movies_subset(), input$n_samp)
  })

  # Create scatterplot object the plotOutput function is expecting
  output$scatterplot <- renderPlot({
    ggplot(data = movies_sample(), aes_string(x = input$x, y = input$y, color = input$z)) +
      geom_point()
  })

  # Print number of movies plotted
  output$n <- renderUI({
    types <- factor(movies_subset()$title_type, levels = input$selected_type)
    counts <- table(types)
    HTML(paste("There are", counts, input$selected_type, "movies plotted in the plot above. <br>"))
  })
}

# Create the Shiny app object --------------------------------------------------

shinyApp(ui = ui, server = server)# Load packages ----------------------------------------------------------------
library(shiny)
library(bslib)
library(ggplot2)
library(dplyr)
# Load data --------------------------------------------------------------------
load("movies.RData")
# Define UI --------------------------------------------------------------------
ui <- page_sidebar(
sidebar = sidebar(
selectInput(
inputId = "y",
label = "Y-axis:",
choices = c(
"IMDB rating" = "imdb_rating",
"IMDB number of votes" = "imdb_num_votes",
"Critics Score" = "critics_score",
"Audience Score" = "audience_score",
"Runtime" = "runtime"
),
selected = "audience_score"
),
selectInput(
inputId = "x",
label = "X-axis:",
choices = c(
"IMDB rating" = "imdb_rating",
"IMDB number of votes" = "imdb_num_votes",
"Critics Score" = "critics_score",
"Audience Score" = "audience_score",
"Runtime" = "runtime"
),
selected = "critics_score"
),
selectInput(
inputId = "z",
label = "Color by:",
choices = c(
"Title Type" = "title_type",
"Genre" = "genre",
"MPAA Rating" = "mpaa_rating",
"Critics Rating" = "critics_rating",
"Audience Rating" = "audience_rating"
),
selected = "mpaa_rating"
),
checkboxGroupInput(
inputId = "selected_type",
label = "Select movie type(s):",
choices = c("Documentary", "Feature Film", "TV Movie"),
selected = "Feature Film"
),
numericInput(
inputId = "n_samp",
label = "Sample size:",
min = 1, max = nrow(movies),
value = 3
)
),
card(
plotOutput(outputId = "scatterplot"),
uiOutput(outputId = "n")
)
)
# Define server ----------------------------------------------------------------
server <- function(input, output, session) {
# Create a subset of data filtering for selected title types
movies_subset <- reactive({
req(input$selected_type)
filter(movies, title_type %in% input$selected_type)
})
# Create new df that is n_samp obs from selected type movies
movies_sample <- reactive({
req(input$n_samp)
sample_n(movies_subset(), input$n_samp)
})
# Create scatterplot object the plotOutput function is expecting
output$scatterplot <- renderPlot({
ggplot(data = movies_sample(), aes_string(x = input$x, y = input$y, color = input$z)) +
geom_point()
})
# Print number of movies plotted
output$n <- renderUI({
types <- movies_sample()$title_type %>%
factor(levels = input$selected_type)
counts <- table(types)
HTML(paste("There are", counts, input$selected_type, "movies plotted in the plot above. <br>"))
})
}
# Create the Shiny app object --------------------------------------------------
shinyApp(ui = ui, server = server)