Reactive Flow
Reactivity, in spreadsheets
One familiar way of thinking about reactivity is to think in the context of a spreadsheet, like Google Sheets or Microsoft Excel.
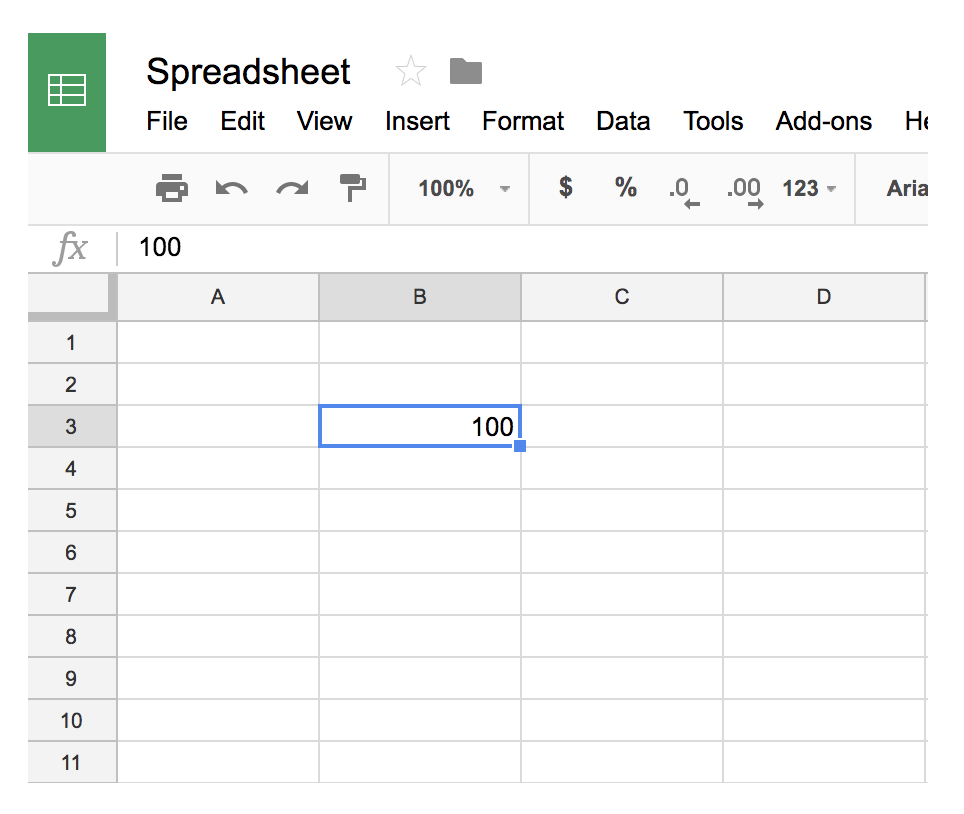
Suppose you write a value into a cell in a spreadsheet…
and then in another cell you write a formula that depends on that cell.
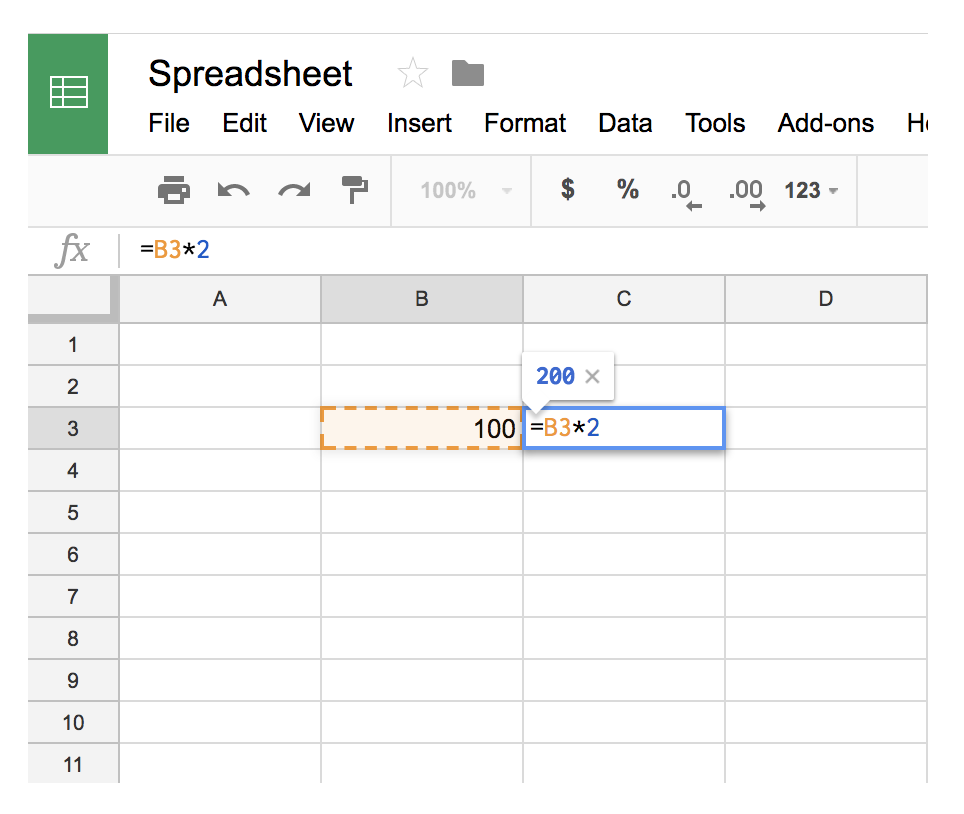
First, the formula is calculated with the value you originally typed.

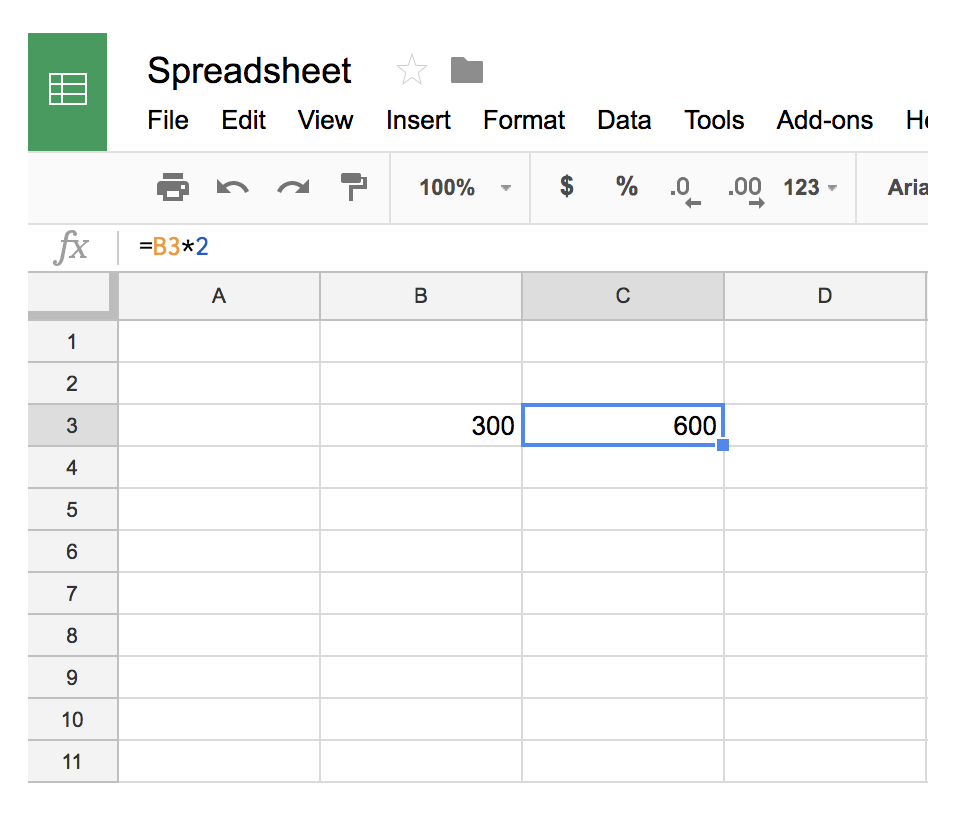
Now when you change the value of the original cell, the result of the formula will automatically update, or in other words, react to this change.
Reactions
In a Shiny app reactivity happens in a similar fashion.
Suppose you have a sliderInput in your app with the inputId of alpha. The value of this input is stored in input$alpha.
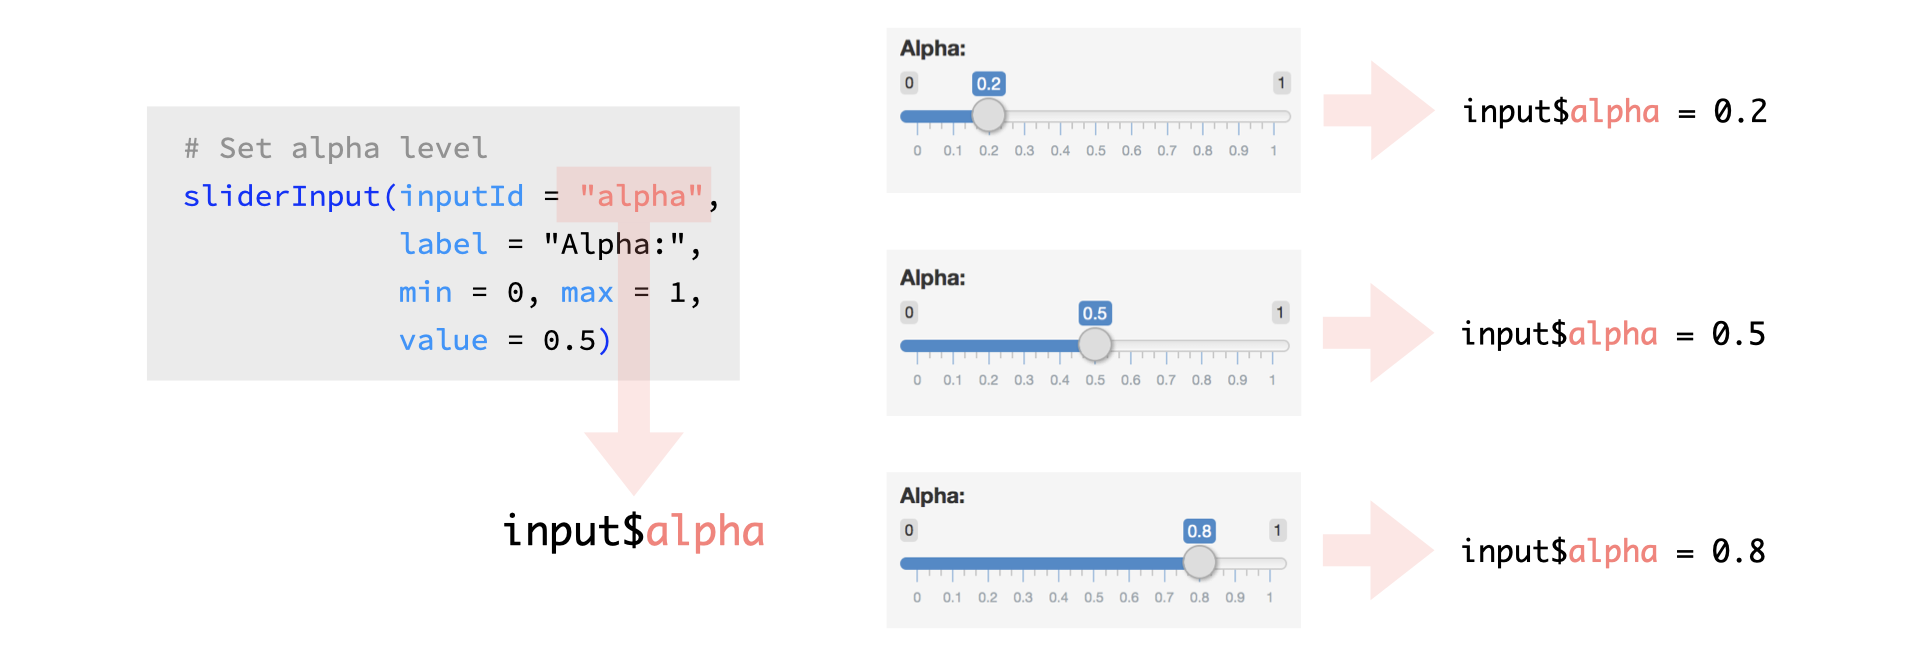
So when the user moves around the slider, the value of the alpha input is updated in the input list.
Reactivity 101
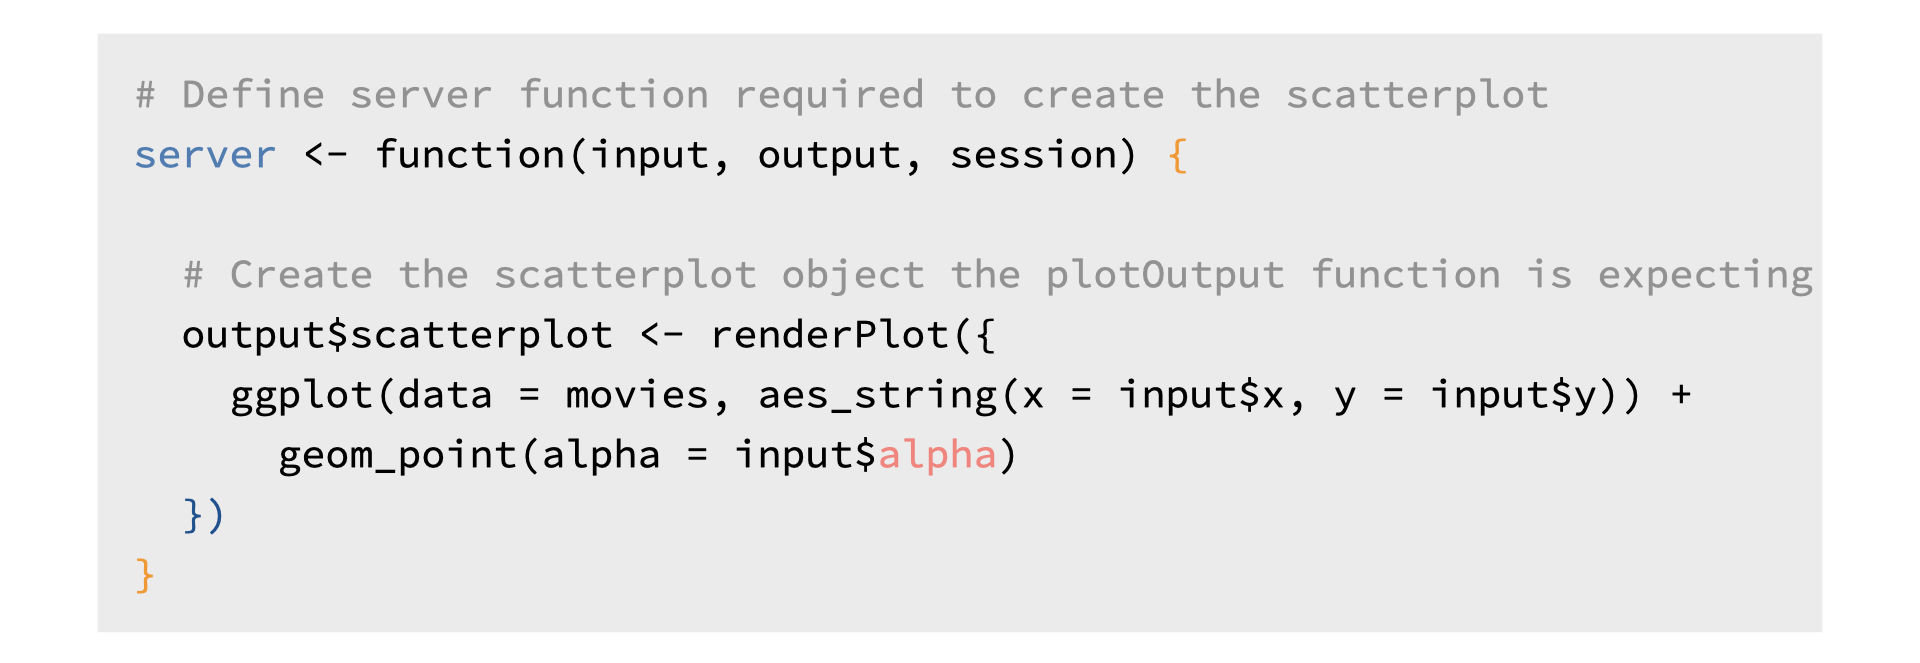
Reactivity automatically occurs when an input value is used to render an output object, i.e. in the server function below the plot is re-rendered when the value of input$alpha changes based on user input. You, as the app developer, do not need to write code that says “Update the plot every time the value of input$alpha changes”, Shiny automatically takes care of this for you in the render*() function.
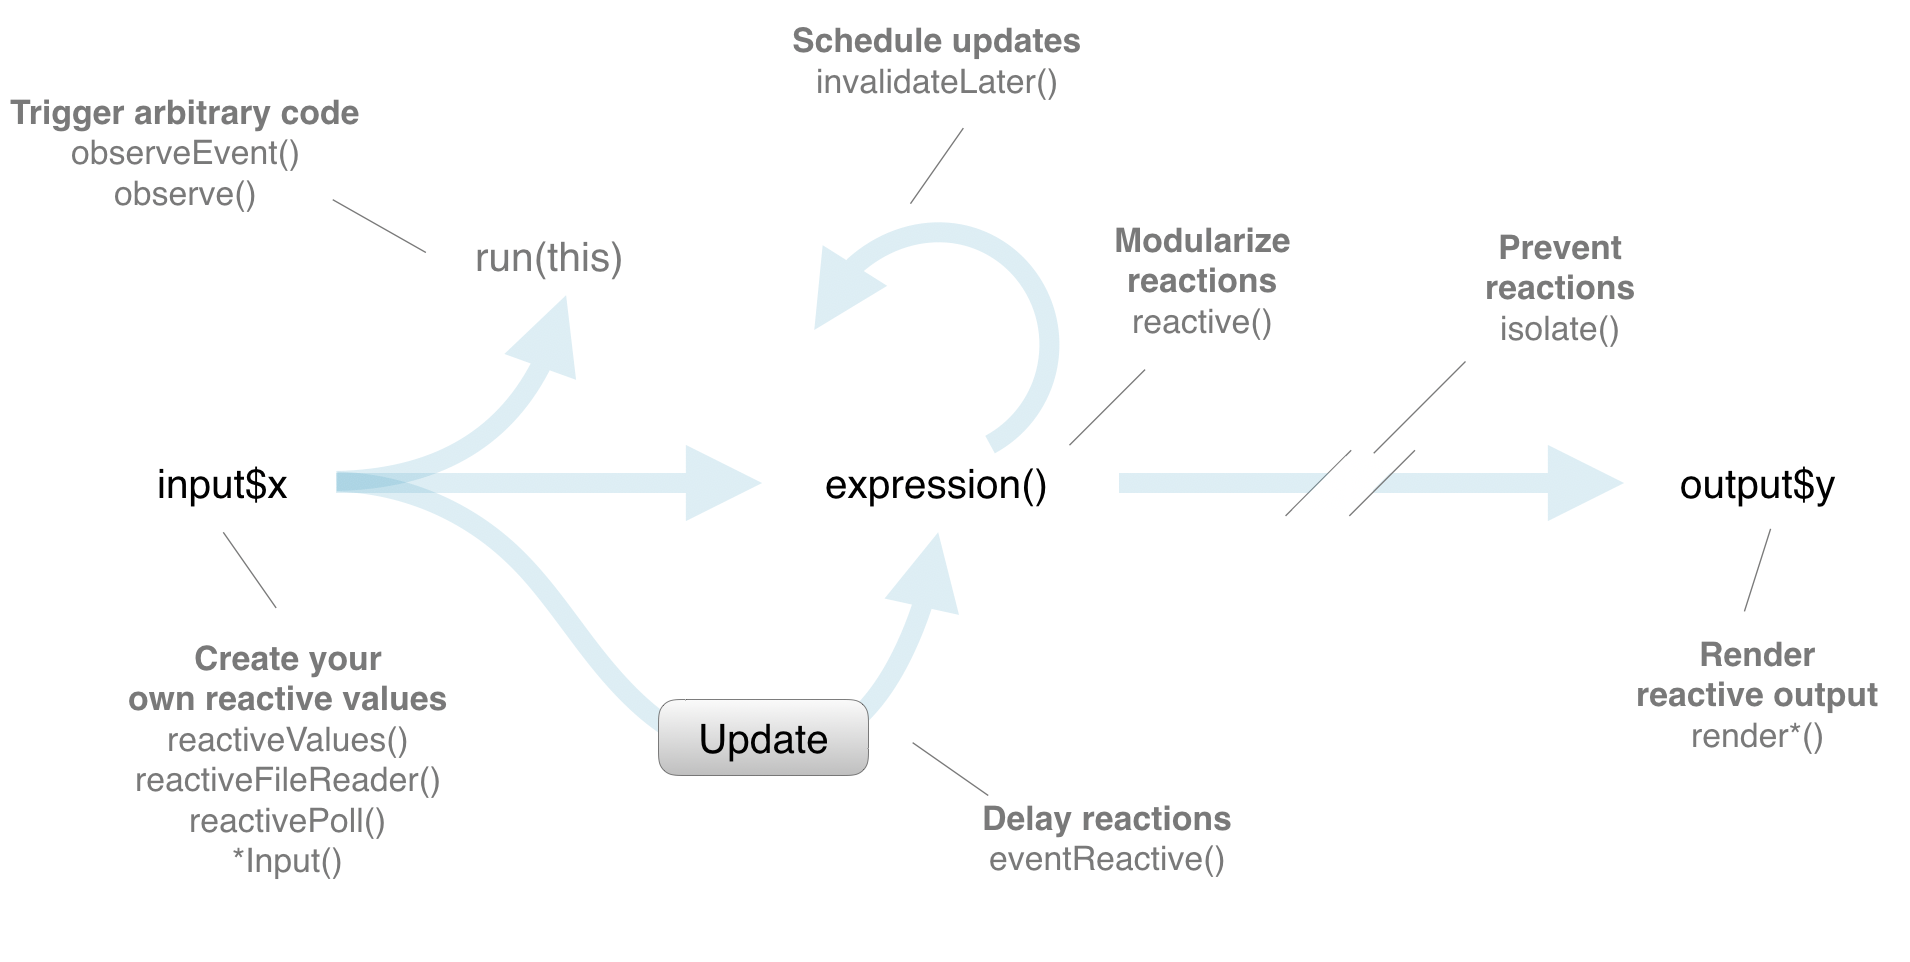
Reactive flow
Here is a roadmap of the reactive flow in Shiny, though for now we’ll just focus on the straight path between an input and an output, and discuss the other features later in the course.
Reactive flow, simplified
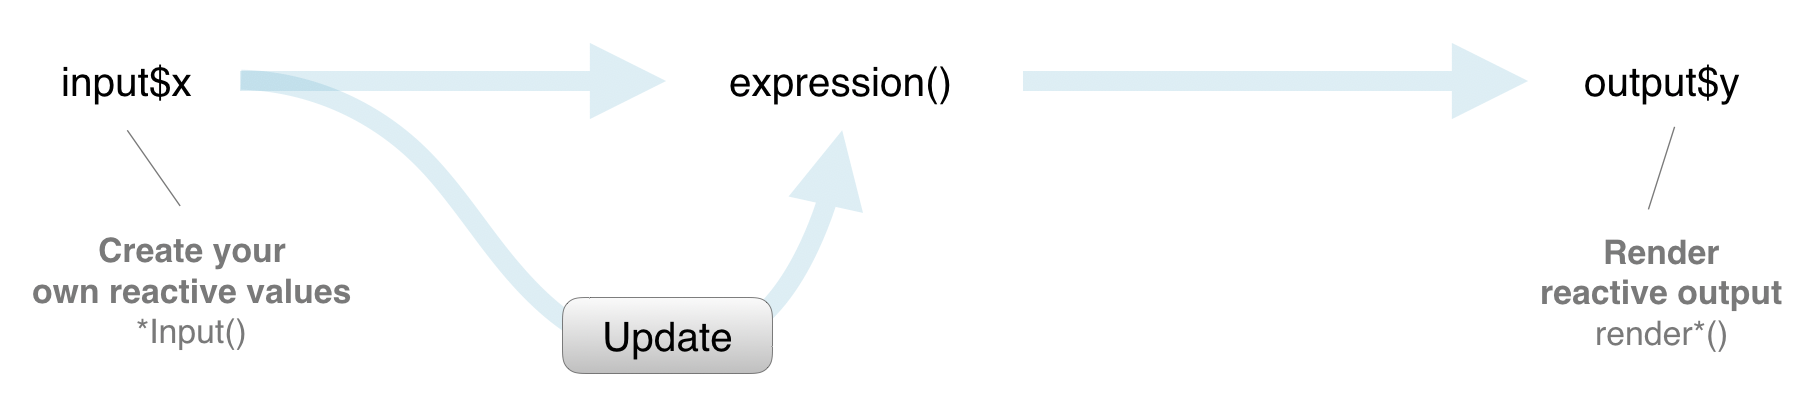
The user selects an input, this input goes through some expression in the server, and an output is rendered. Each time the user changes their input selection, the expression that generates the output will automatically re-execute, and the relevant output will be re-rendered based on the new value of the input.
In a Shiny application, there’s no need to explictly describe the relationships between inputs and outputs and tell R what to do when each input changes, Shiny automatically handles these details for you.
Practice: Building a reactive widget
As we saw in the previous sections, reactivity is established by linking an input with an output via a render*() function.
Your turn
Add a new input widget, a
sliderInput, that controls the transparency of the plotted points. This widget should have the IDalphaand its values should range between 0 and 1. You can decide what the displayed label and initial value of the slider should be.Make the associated update in the server function.
Complete the exercise by navigating to the Posit Cloud Project titled 2-1a Building a reactive widget in your Posit Cloud Workspace
- Download the data if you haven’t already
```{r}
# Get the data

file <- "https://github.com/rstudio-education/shiny-course/raw/main/movies.RData"
destfile <- "movies.RData"

download.file(file, destfile)
```- Copy the code below into an R script
# Load packages ----------------------------------------------------------------

library(shiny)
library(ggplot2)
library(bslib)

# Load data --------------------------------------------------------------------

load("movies.RData")

# Define UI --------------------------------------------------------------------

ui <- page_sidebar(


    sidebar = sidebar(

      selectInput(inputId = "y",
                  label = "Y-axis:",
                  choices = c("imdb_rating", "imdb_num_votes", "critics_score", "audience_score", "runtime"),
                  selected = "audience_score"),

      selectInput(inputId = "x",
                  label = "X-axis:",
                  choices = c("imdb_rating", "imdb_num_votes", "critics_score", "audience_score", "runtime"),
                  selected = "critics_score"),

      # Set alpha level
      sliderInput(inputId = ___,
                  label = ___,
                  min = ___, max = ___,
                  value = ___)
    ),

    card(
      plotOutput(outputId = "scatterplot")
    )
)

# Define server ----------------------------------------------------------------

server <- function(input, output, session) {

  output$scatterplot <- renderPlot({
    ggplot(data = movies, aes_string(x = input$x, y = input$y)) +
      geom_point(alpha = ___)
  })

}

# Create the Shiny app object --------------------------------------------------

shinyApp(ui = ui, server = server)# Load packages ----------------------------------------------------------------
library(shiny)
library(ggplot2)
library(bslib)
# Load data --------------------------------------------------------------------
load("movies.RData")
# Define UI --------------------------------------------------------------------
ui <- page_sidebar(
sidebar = sidebar(
selectInput(
inputId = "y",
label = "Y-axis:",
choices = c("imdb_rating", "imdb_num_votes", "critics_score", "audience_score", "runtime"),
selected = "audience_score"
),
selectInput(
inputId = "x",
label = "X-axis:",
choices = c("imdb_rating", "imdb_num_votes", "critics_score", "audience_score", "runtime"),
selected = "critics_score"
),
sliderInput(
inputId = "alpha",
label = "Alpha:",
min = 0, max = 1,
value = 0.5
)
),
card(
plotOutput(outputId = "scatterplot")
)
)
# Define server ----------------------------------------------------------------
server <- function(input, output, session) {
output$scatterplot <- renderPlot({
ggplot(data = movies, aes_string(x = input$x, y = input$y)) +
geom_point(alpha = input$alpha)
})
}
# Create the Shiny app object --------------------------------------------------
shinyApp(ui = ui, server = server)Practice: Dude, where’s my plot?
The server function of this app builds two plots, scatterplot and densityplot, however the app only displays one.
Your turn
Run the app and identify which plot is missing
Make the necessary update to the app UI to display the missing plot
Reduce the height of the new plot using the
heightargument in theplotOutput()function (suggested height:height = 200)
Hint: Make sure you place commas as appropriate.
Complete the exercise by navigating to the RStudio Cloud Project titled 2-1b Dude wheres my plot in your Posit Cloud Workspace
- Copy the code below into an R script
# Load packages ----------------------------------------------------------------

library(shiny)
library(ggplot2)
library(bslib)

# Load data --------------------------------------------------------------------

load("movies.RData")

# Define UI --------------------------------------------------------------------

ui <- page_sidebar(


    sidebar = sidebar(

      selectInput(inputId = "y",
                  label = "Y-axis:",
                  choices = c("imdb_rating", "imdb_num_votes", "critics_score", "audience_score", "runtime"),
                  selected = "audience_score"),

      selectInput(inputId = "x",
                  label = "X-axis:",
                  choices = c("imdb_rating", "imdb_num_votes", "critics_score", "audience_score", "runtime"),
                  selected = "critics_score")
    ),

    card(
      plotOutput(outputId = "scatterplot")
    )
)

# Define server ----------------------------------------------------------------

server <- function(input, output, session) {

  output$scatterplot <- renderPlot({
    ggplot(data = movies, aes_string(x = input$x, y = input$y)) +
      geom_point()
  })

  output$densityplot <- renderPlot({
    ggplot(data = movies, aes_string(x = input$x)) +
      geom_density()
  })

}

# Create the Shiny app object --------------------------------------------------

shinyApp(ui = ui, server = server)# Load packages ----------------------------------------------------------------
library(shiny)
library(ggplot2)
library(bslib)
# Load data --------------------------------------------------------------------
load("movies.RData")
# Define UI --------------------------------------------------------------------
ui <- page_sidebar(
sidebar = sidebar(
selectInput(
inputId = "y",
label = "Y-axis:",
choices = c("imdb_rating", "imdb_num_votes", "critics_score", "audience_score", "runtime"),
selected = "audience_score"
),
selectInput(
inputId = "x",
label = "X-axis:",
choices = c("imdb_rating", "imdb_num_votes", "critics_score", "audience_score", "runtime"),
selected = "critics_score"
)
),
card(
plotOutput(outputId = "scatterplot"),
plotOutput(outputId = "densityplot", height = 200)
)
)
# Define server ----------------------------------------------------------------
server <- function(input, output, session) {
output$scatterplot <- renderPlot({
ggplot(data = movies, aes_string(x = input$x, y = input$y)) +
geom_point()
})
output$densityplot <- renderPlot({
ggplot(data = movies, aes_string(x = input$x)) +
geom_density()
})
}
# Create the Shiny app object --------------------------------------------------
shinyApp(ui = ui, server = server)