Stop-trigger-delay
In this section we present how to stop, trigger, and delay Shiny actions.
Isolating reactions
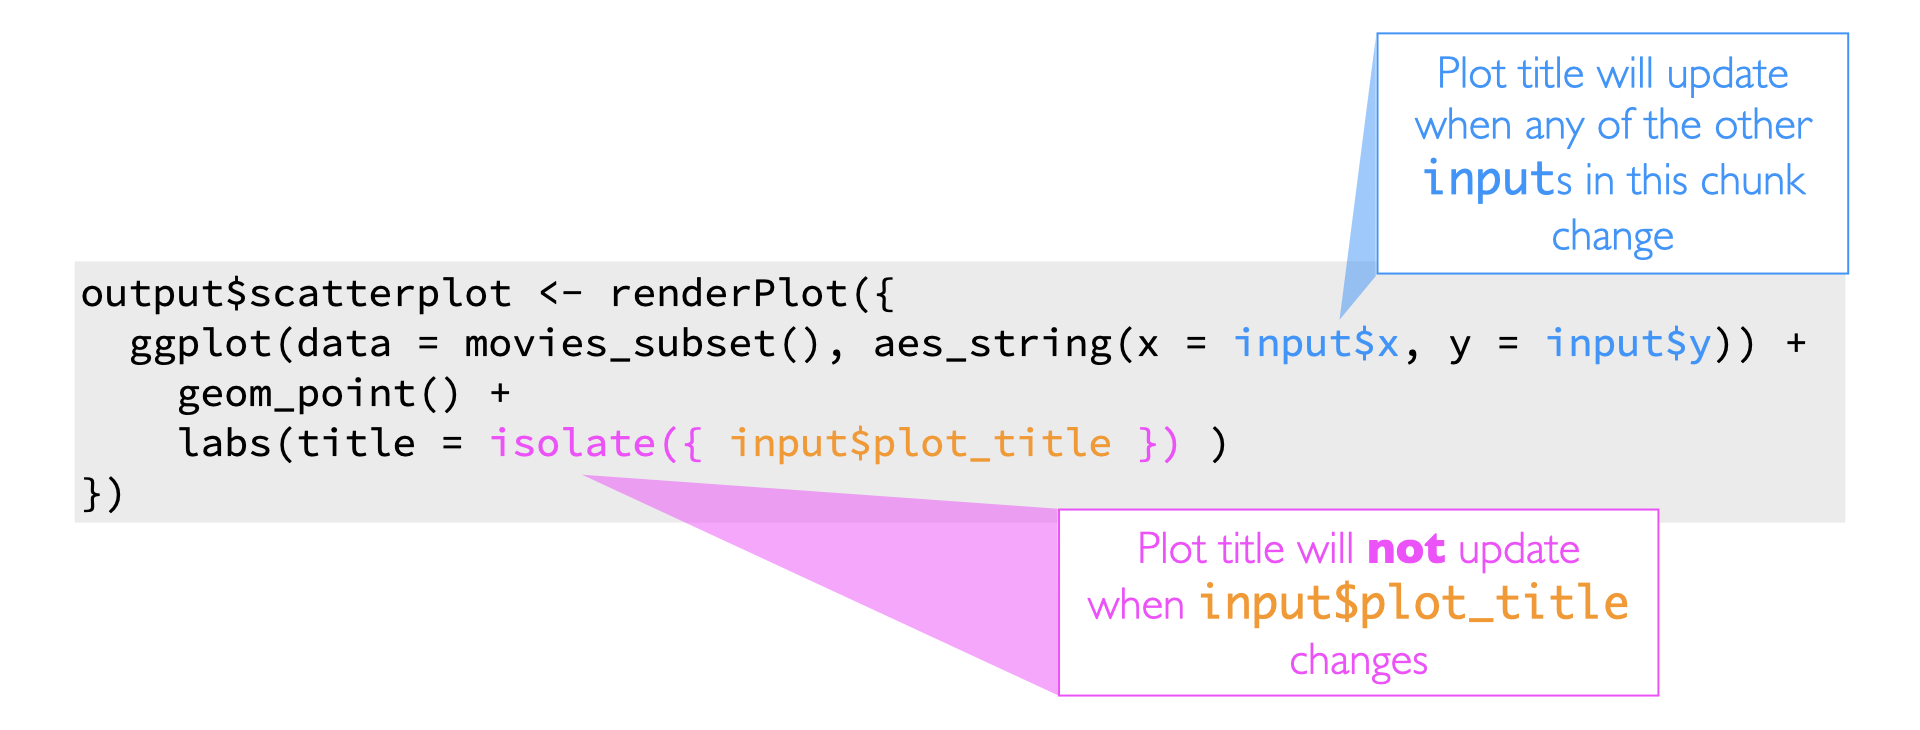
Suppose your app has an input widget where users can enter text for the title of the plot. However you only want the title to update if any of the other inputs that go into the plot change. You can achieve this by isolating the plot title such that…
- When
input$xorinput$ychanges, the plot, along with the title, will update. - But when only the title input (
input$plot_title) changes, the plot will not update.
Triggering reactions
For triggering reactions, we use observeEvent(). So why might one want to explicitly trigger a reaction?
Sometimes you might want to wait for a specific action to be taken from the user, like clicking an action button, before calculating an expression or taking an action. A reactive value or expression that is used to trigger other calculations in this way is called an event.
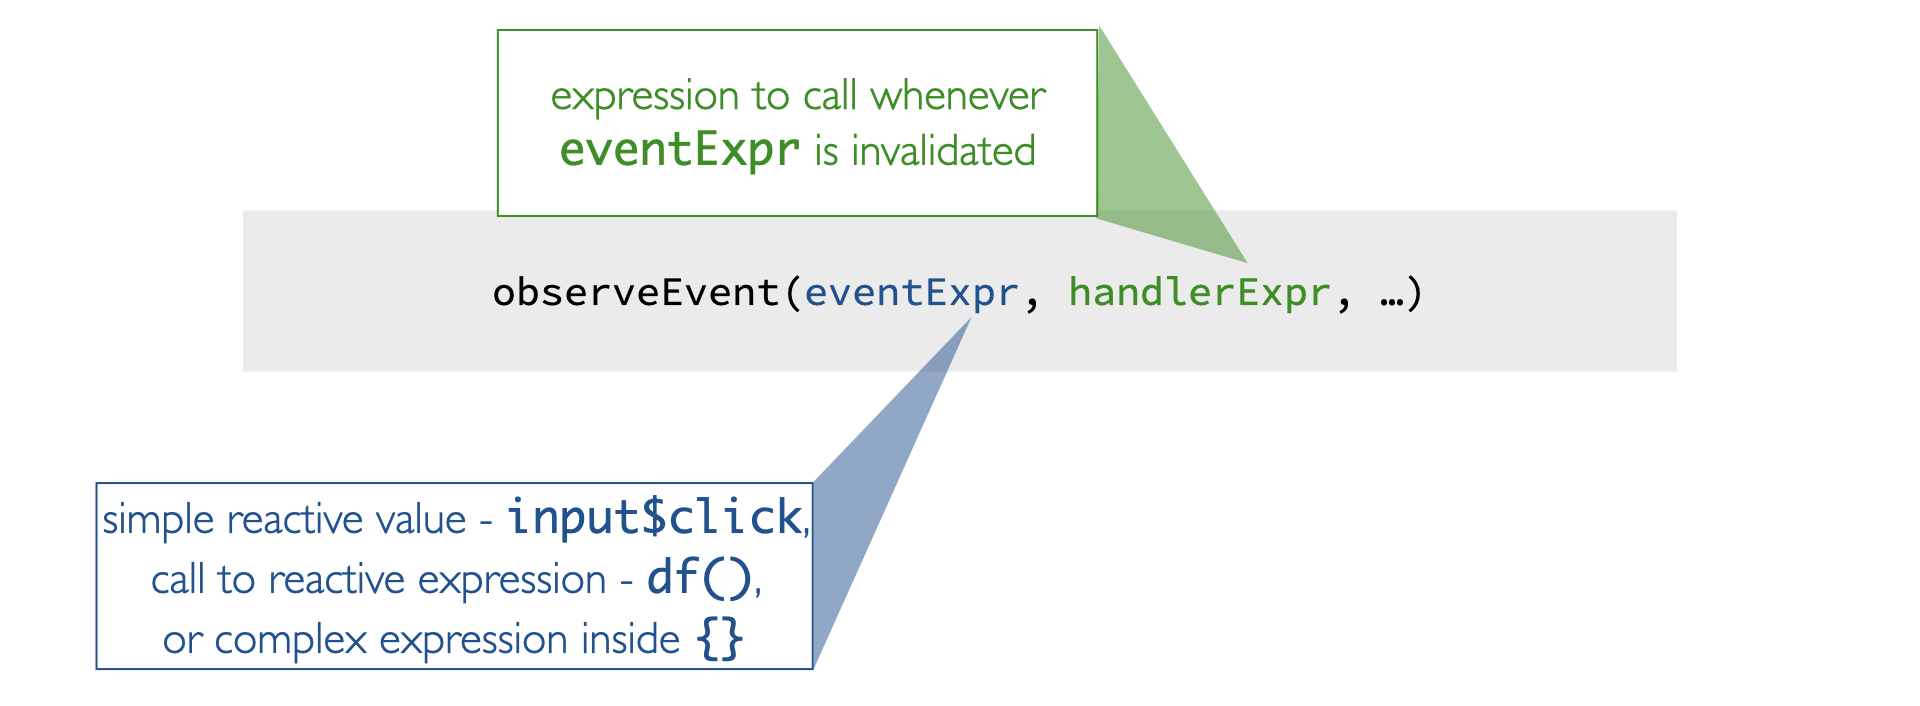
These events can be the first argument in the
observeEvent()function. This argument can be a simple reactive value like an input, a call to a reactive expression, or a complex expression provided wrapped in curly braces.The second argument is the expression to call whenever the first argument is invalidated.
So what you see here is similar to saying “if event expression happens, call handler expression”.
Suppose your app allows for taking a random sample of the data based on a sample size numeric input. Suppose also that you want to add functionality for the users to download the random sample they generated if they press an action button (actionButton()) requesting to do so.
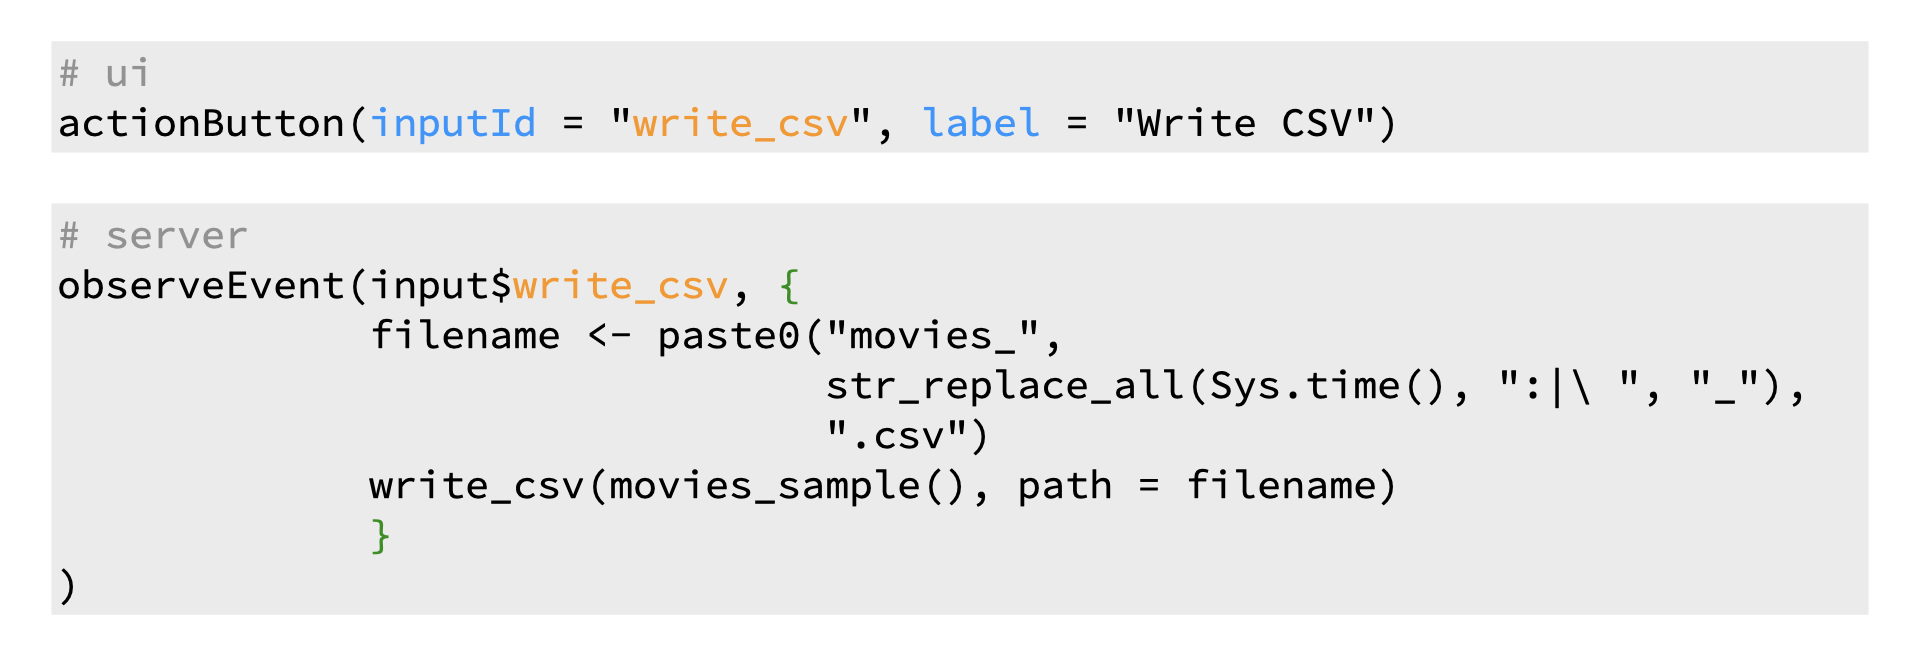
- In the UI, we create an action button.
- And in the server, we condition the
observeEvent()on theinputIdof that action button. This way R knows to call the expression given in the second argument ofobserveEvent()when the user presses the action button.
Delaying reactions
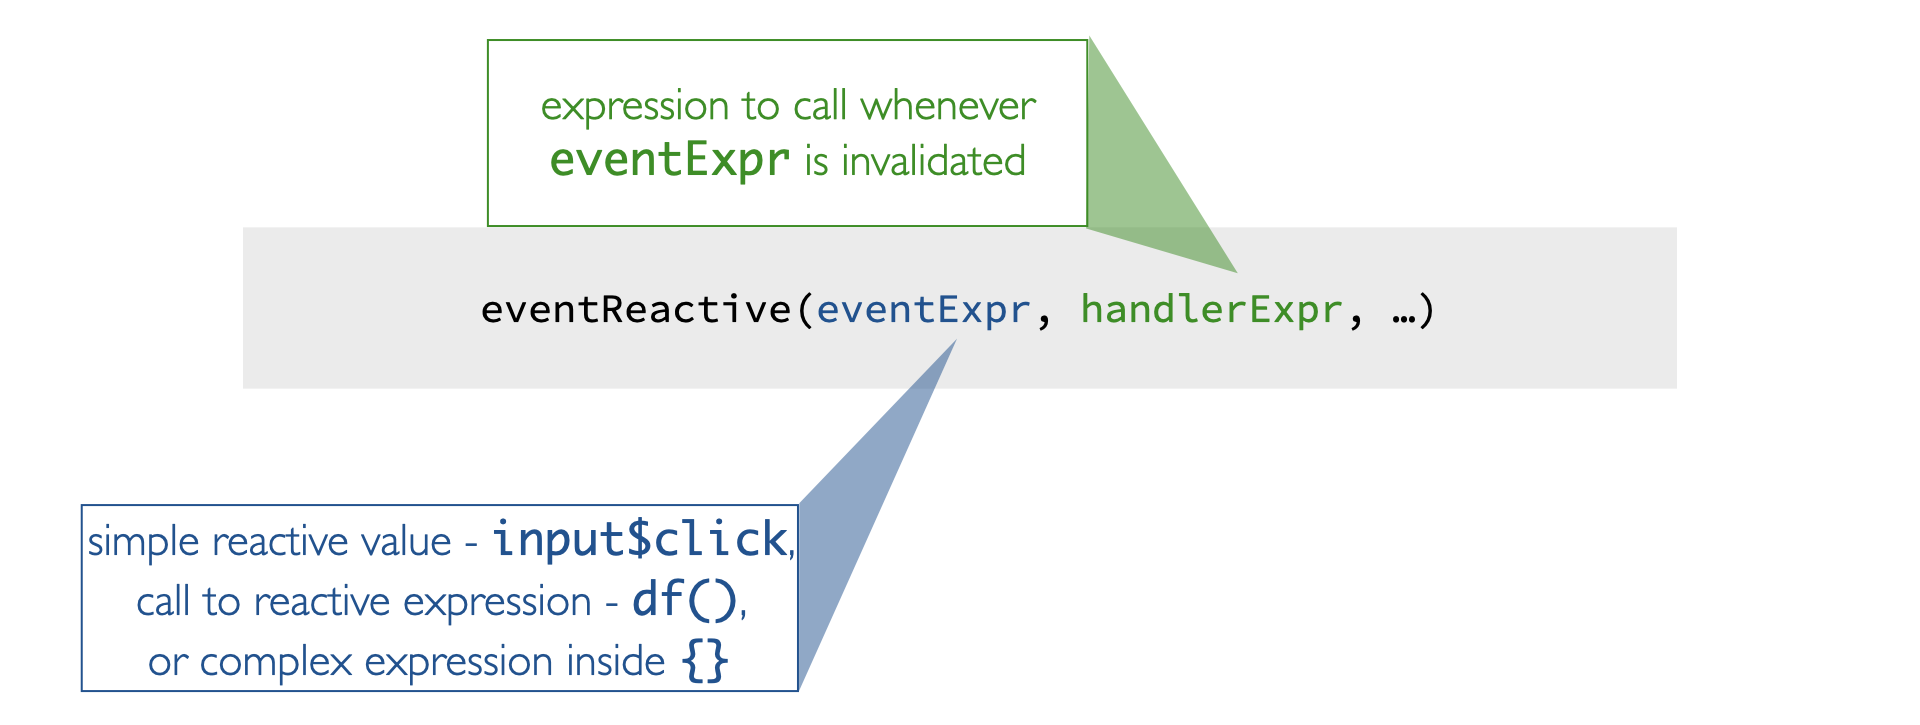
And finally we can delay reactions with eventReactive(), which takes similar arguments as observeEvent().
Suppose your goal is to change how users take random samples in your app – you only want them to get a new sample when an action button that says “get new sample” is pressed, not when other things like a numeric input defining the size of the sample changes.
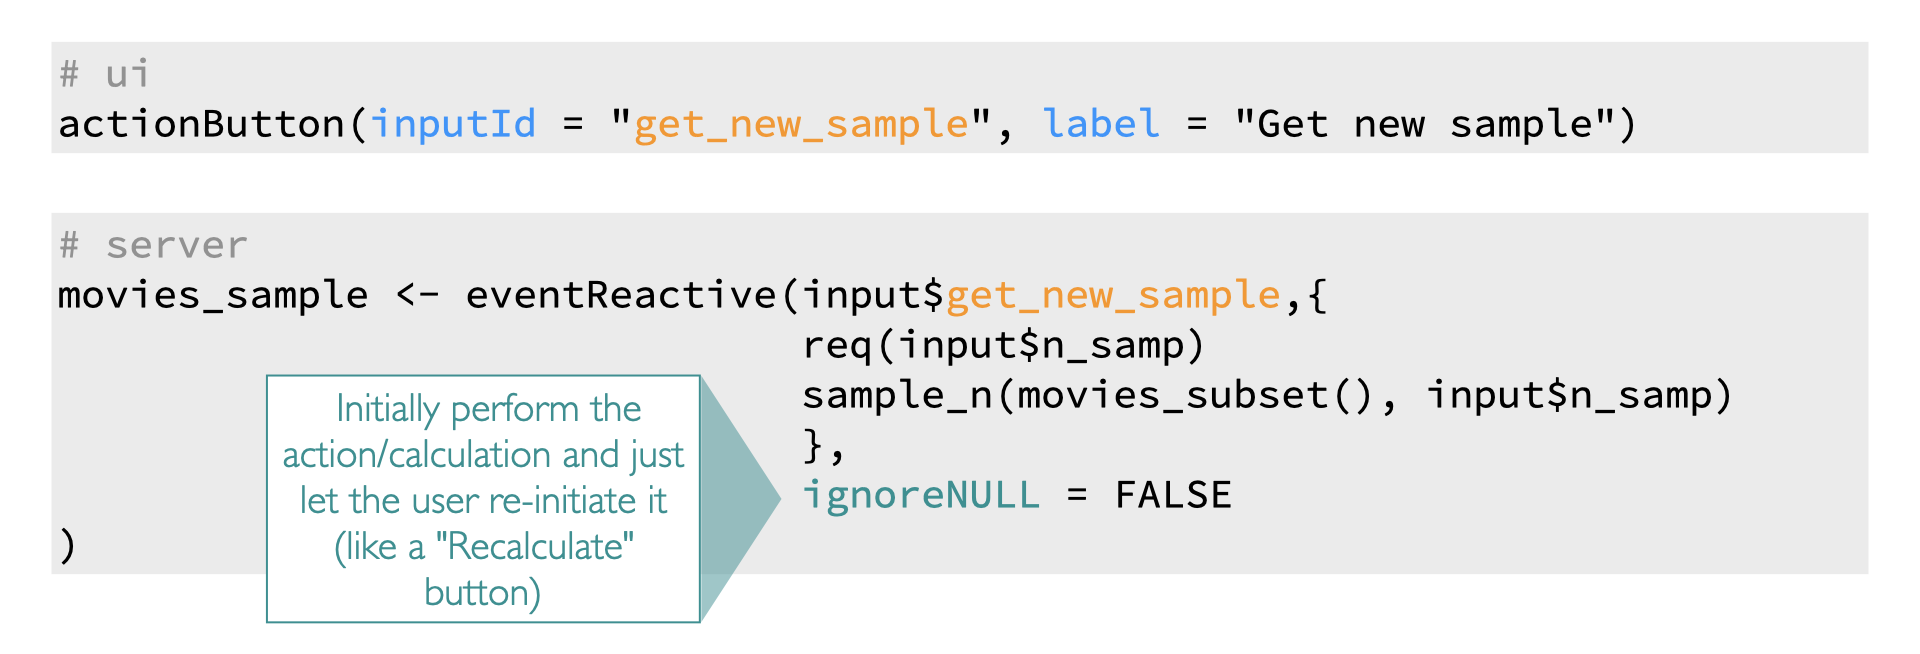
- In the
eventReactive()function, the first argument is the input associated with the action button, and the second argument is the sampling code. - Then, we add one more argument –
ignoreNull. This argument tells R what to do (or what not to do) when the event expression evaluates toNull. For example, what should the app do when the app is first launched and the user has not even interacted with the app yet? If this is set toFALSE, the app will initially perform the action or calculation and then the user can re-initiate it.
observeEvent() vs eventReactive()
observeEvent() and eventReactive() look and feel very similar – same syntax, same arguments, but they’re actually not the same at all!
observeEvent()is used to perform an action in response to an eventeventReactive()is used to create a calculated value that only updates in response to an event
observeEvent()/eventReactive() vs. observe()/reactive()
This pair of functions also seem similar, at a first glance, to the observe/reactive pair, however the main difference between them is that
observe()andreactive()functions automatically trigger on whatever they accessobserveEvent()andeventReactive()functions need to be explicitly told what triggers them
isolate() vs event handling functions
And where does isolate fit in all this?
isolate()is used to stop a reactionobserveEvent()is used to perform an action in response to an eventeventReactive()is used to create a calculated value that only updates in response to an event
Practice - Stop with isolate()
In the following app, the user, in addition to controlling which variables are plotted, can adjust the size and transparency of points and define the plot title.
Your turn
Run the code and test out the functionality of the plot title input. Is the plot title updated immediately after you’re done typing the title?
Modify the app so that the plot title only gets updated when one of the other inputs is changed.
Complete the exercise by navigating to the Posit Cloud Project titled 3-4a Stop with isolate() in your Posit Cloud Workspace
# Load packages ----------------------------------------------------------------

library(shiny)
library(bslib)
library(ggplot2)
library(tools)

# Load data --------------------------------------------------------------------

load("movies.RData")

# Define UI --------------------------------------------------------------------

ui <- page_sidebar(
    sidebar = sidebar(
      selectInput(
        inputId = "y",
        label = "Y-axis:",
        choices = c(
          "IMDB rating" = "imdb_rating",
          "IMDB number of votes" = "imdb_num_votes",
          "Critics Score" = "critics_score",
          "Audience Score" = "audience_score",
          "Runtime" = "runtime"
        ),
        selected = "audience_score"
      ),

      selectInput(
        inputId = "x",
        label = "X-axis:",
        choices = c(
          "IMDB rating" = "imdb_rating",
          "IMDB number of votes" = "imdb_num_votes",
          "Critics Score" = "critics_score",
          "Audience Score" = "audience_score",
          "Runtime" = "runtime"
        ),
        selected = "critics_score"
      ),

      selectInput(
        inputId = "z",
        label = "Color by:",
        choices = c(
          "Title Type" = "title_type",
          "Genre" = "genre",
          "MPAA Rating" = "mpaa_rating",
          "Critics Rating" = "critics_rating",
          "Audience Rating" = "audience_rating"
        ),
        selected = "mpaa_rating"
      ),

      sliderInput(
        inputId = "alpha",
        label = "Alpha:",
        min = 0, max = 1,
        value = 0.5
      ),

      sliderInput(
        inputId = "size",
        label = "Size:",
        min = 0, max = 5,
        value = 2
      ),

      textInput(
        inputId = "plot_title",
        label = "Plot title",
        placeholder = "Enter text to be used as plot title"
      )
    ),

    card(
      plotOutput(outputId = "scatterplot")
    )
)

# Define server ----------------------------------------------------------------

server <- function(input, output, session) {
  output$scatterplot <- renderPlot({
    ggplot(data = movies, aes_string(x = input$x, y = input$y, color = input$z)) +
      geom_point(alpha = input$alpha, size = input$size) +
      labs(title = toTitleCase(input$plot_title))
  })
}

# Create the Shiny app object --------------------------------------------------

shinyApp(ui = ui, server = server)# Load packages ----------------------------------------------------------------
library(shiny)
library(bslib)
library(ggplot2)
library(tools)
# Load data --------------------------------------------------------------------
load("movies.RData")
# Define UI --------------------------------------------------------------------
ui <- page_sidebar(
sidebar = sidebar(
selectInput(
inputId = "y",
label = "Y-axis:",
choices = c(
"IMDB rating" = "imdb_rating",
"IMDB number of votes" = "imdb_num_votes",
"Critics Score" = "critics_score",
"Audience Score" = "audience_score",
"Runtime" = "runtime"
),
selected = "audience_score"
),
selectInput(
inputId = "x",
label = "X-axis:",
choices = c(
"IMDB rating" = "imdb_rating",
"IMDB number of votes" = "imdb_num_votes",
"Critics Score" = "critics_score",
"Audience Score" = "audience_score",
"Runtime" = "runtime"
),
selected = "critics_score"
),
selectInput(
inputId = "z",
label = "Color by:",
choices = c(
"Title Type" = "title_type",
"Genre" = "genre",
"MPAA Rating" = "mpaa_rating",
"Critics Rating" = "critics_rating",
"Audience Rating" = "audience_rating"
),
selected = "mpaa_rating"
),
sliderInput(
inputId = "alpha",
label = "Alpha:",
min = 0, max = 1,
value = 0.5
),
sliderInput(
inputId = "size",
label = "Size:",
min = 0, max = 5,
value = 2
),
textInput(
inputId = "plot_title",
label = "Plot title",
placeholder = "Enter text to be used as plot title"
)
),
card(
plotOutput(outputId = "scatterplot")
)
)
# Define server ----------------------------------------------------------------
server <- function(input, output, session) {
output$scatterplot <- renderPlot({
ggplot(data = movies, aes_string(x = input$x, y = input$y, color = input$z)) +
geom_point(alpha = input$alpha, size = input$size) +
labs(title = isolate({
toTitleCase(input$plot_title)
}))
})
}
# Create the Shiny app object --------------------------------------------------
shinyApp(ui = ui, server = server)Practice - Delay with eventReactive()
The following app has the same starter code as the previous exercise.
Your turn
- Modify the app such that the title is updated only when a button titled “Update plot title” is clicked.
Complete the exercise by navigating to the Posit Cloud Project titled 3-4b Delay with eventReactive() in your Posit Cloud Workspace
# Load packages ----------------------------------------------------------------

library(shiny)
library(bslib)
library(ggplot2)
library(tools)

# Load data --------------------------------------------------------------------

load("movies.RData")

# Define UI --------------------------------------------------------------------

ui <- page_sidebar(
    sidebar = sidebar(
      selectInput(
        inputId = "y",
        label = "Y-axis:",
        choices = c(
          "IMDB rating" = "imdb_rating",
          "IMDB number of votes" = "imdb_num_votes",
          "Critics Score" = "critics_score",
          "Audience Score" = "audience_score",
          "Runtime" = "runtime"
        ),
        selected = "audience_score"
      ),

      selectInput(
        inputId = "x",
        label = "X-axis:",
        choices = c(
          "IMDB rating" = "imdb_rating",
          "IMDB number of votes" = "imdb_num_votes",
          "Critics Score" = "critics_score",
          "Audience Score" = "audience_score",
          "Runtime" = "runtime"
        ),
        selected = "critics_score"
      ),

      selectInput(
        inputId = "z",
        label = "Color by:",
        choices = c(
          "Title Type" = "title_type",
          "Genre" = "genre",
          "MPAA Rating" = "mpaa_rating",
          "Critics Rating" = "critics_rating",
          "Audience Rating" = "audience_rating"
        ),
        selected = "mpaa_rating"
      ),

      sliderInput(
        inputId = "alpha",
        label = "Alpha:",
        min = 0, max = 1,
        value = 0.5
      ),

      sliderInput(
        inputId = "size",
        label = "Size:",
        min = 0, max = 5,
        value = 2
      ),

      textInput(
        inputId = "plot_title",
        label = "Plot title",
        placeholder = "Enter text to be used as plot title"
      )
    ),

    card(
      plotOutput(outputId = "scatterplot")
    )
)

# Define server ----------------------------------------------------------------

server <- function(input, output, session) {
  output$scatterplot <- renderPlot({
    ggplot(data = movies, aes_string(x = input$x, y = input$y, color = input$z)) +
      geom_point(alpha = input$alpha, size = input$size) +
      labs(title = toTitleCase(input$plot_title))
  })
}

# Create the Shiny app object --------------------------------------------------

shinyApp(ui = ui, server = server)# Load packages ----------------------------------------------------------------
library(shiny)
library(bslib)
library(ggplot2)
library(tools)
# Load data --------------------------------------------------------------------
load("movies.RData")
# Define UI --------------------------------------------------------------------
ui <- page_sidebar(
sidebar = sidebar(
selectInput(
inputId = "y",
label = "Y-axis:",
choices = c(
"IMDB rating" = "imdb_rating",
"IMDB number of votes" = "imdb_num_votes",
"Critics Score" = "critics_score",
"Audience Score" = "audience_score",
"Runtime" = "runtime"
),
selected = "audience_score"
),
selectInput(
inputId = "x",
label = "X-axis:",
choices = c(
"IMDB rating" = "imdb_rating",
"IMDB number of votes" = "imdb_num_votes",
"Critics Score" = "critics_score",
"Audience Score" = "audience_score",
"Runtime" = "runtime"
),
selected = "critics_score"
),
selectInput(
inputId = "z",
label = "Color by:",
choices = c(
"Title Type" = "title_type",
"Genre" = "genre",
"MPAA Rating" = "mpaa_rating",
"Critics Rating" = "critics_rating",
"Audience Rating" = "audience_rating"
),
selected = "mpaa_rating"
),
sliderInput(
inputId = "alpha",
label = "Alpha:",
min = 0, max = 1,
value = 0.5
),
sliderInput(
inputId = "size",
label = "Size:",
min = 0, max = 5,
value = 2
),
textInput(
inputId = "plot_title",
label = "Plot title",
placeholder = "Enter text to be used as plot title"
),
actionButton(
inputId = "update_plot_title",
label = "Update plot title"
)
),
card(
plotOutput(outputId = "scatterplot")
)
)
# Define server ----------------------------------------------------------------
server <- function(input, output, session) {
new_plot_title <- eventReactive(
eventExpr = input$update_plot_title,
valueExpr = {
toTitleCase(input$plot_title)
}
)
output$scatterplot <- renderPlot({
ggplot(data = movies, aes_string(x = input$x, y = input$y, color = input$z)) +
geom_point(alpha = input$alpha, size = input$size) +
labs(title = new_plot_title())
})
}
# Create the Shiny app object --------------------------------------------------
shinyApp(ui = ui, server = server)Practice - Trigger with observeEvent()
In this app we want two things to happen when an action button is clicked:
- A message printed to the console stating how many records are shown and
- A table output of those records.
Your turn
Fill in the necessary function and input ID for printing a message to the console when the action button is clicked.
Set up a table output that will print only when action button is clicked, but not when other inputs that go into the creation of that output changes.
Complete the exercise by navigating to the Posit Cloud Project titled 3-4c Trigger with observeEvent() in your Posit Cloud Workspace
# Load packages ----------------------------------------------------------------

library(shiny)
library(bslib)

# Load data --------------------------------------------------------------------

load("movies.RData")

# Define UI --------------------------------------------------------------------

ui <- page_sidebar(
    sidebar = sidebar(
      numericInput(
        inputId = "n_rows",
        label = "How many rows do you want to see?",
        value = 10
      ),

      actionButton(
        inputId = "button",
        label = "Show"
      )
    ),

    card(
      tableOutput(outputId = "datatable")
    )
)

# Define server ----------------------------------------------------------------

server <- function(input, output, session) {

  # Print a message to the console every time button is pressed;
  ___(input$___, {
    cat("Showing", input$n_rows, "rows\n")
  })

  # Take a reactive dependency on input$button, but not on any other inputs
  df <- ___(input$___, {
    head(movies, input$n_rows)
  })
  output$___ <- ___({
    df()
  })

}

# Create the Shiny app object --------------------------------------------------

shinyApp(ui = ui, server = server)# Load packages ----------------------------------------------------------------
library(shiny)
library(bslib)
# Load data --------------------------------------------------------------------
load("movies.RData")
# Define UI --------------------------------------------------------------------
ui <- page_sidebar(
sidebar = sidebar(
numericInput(
inputId = "n_rows",
label = "How many rows do you want to see?",
value = 10
),
actionButton(
inputId = "button",
label = "Show"
)
),
card(
tableOutput(outputId = "datatable")
)
)
# Define server ----------------------------------------------------------------
server <- function(input, output, session) {
# Pring a message to the console every time button is pressed;
observeEvent(input$button, {
cat("Showing", input$n_rows, "rows\n")
})
# Take a reactive dependency on input$button,
# but not on any of the stuff inside the function
df <- eventReactive(input$button, {
head(movies, input$n_rows)
})
output$datatable <- renderTable({
df()
})
}
# Create the Shiny app object --------------------------------------------------
shinyApp(ui = ui, server = server)Practice - Difference between eventReactive() and observeEvent()
Which of the following is false?
observeEvent()is used to perform an action in response to an eventisolate()is used to trigger a reactioneventReactive()is used to create a calculated value that only updates in response to an event- Recalculating a value does not generally count as performing an action