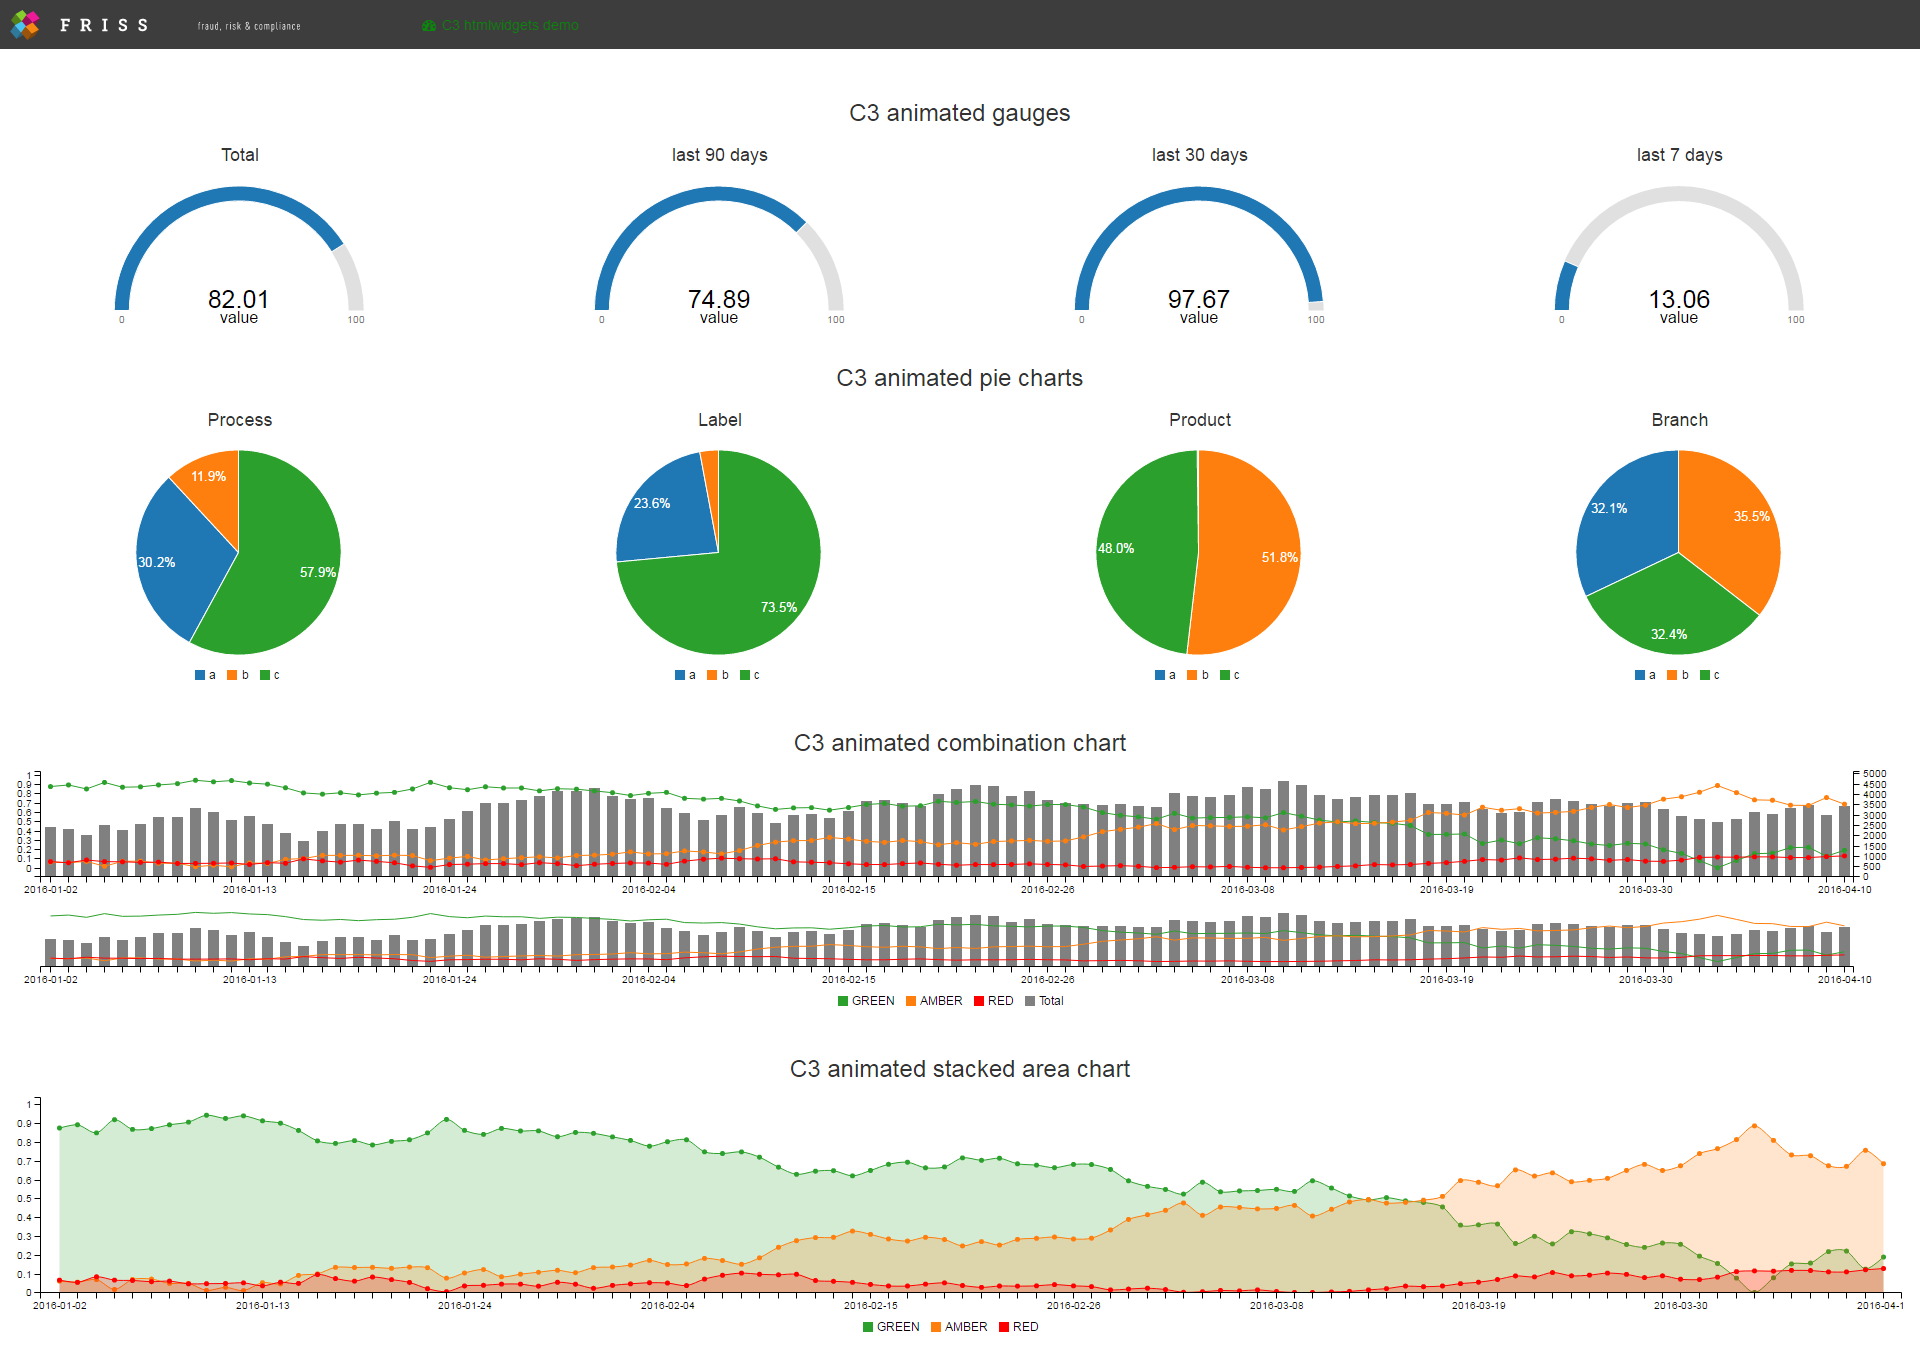
jsonlite::toJSON(list('data1'=30,'data2'=120)){"data1":[30],"data2":[120]} In this article, we expand the widget to create smooth transitions like those in the showcase dashboard app. We also provide code and examples for the other charts types shown in the dashboard – a pie chart, a line + bar chart and a stacked area chart.
In the previous tutorial, we created a simple C3 based gauge widget. In this tutorial, we expand the widget to create smooth transitions like those in the showcase dashboard app. We also provide code and examples for the other charts types shown in the dashboard: a pie chart, a line + bar chart and a stacked area chart. In this tutorial, we focus on pairing charts and data in such a way that C3 can animate the transition between old and new data.
Before we do all that, let’s take a better look at the HTMLWidgets.widget function we saw in the first tutorial, which is related to the concept of factory methods and closures.
In the previous tutorial, we saw that the skeleton of our widget initially looks like this
HTMLWidgets.widget({

  name: 'C3Gauge',

  type: 'output',

  factory: function(el, width, height) {

    // TODO: define shared variables for this instance

    return {

      renderValue: function(x) {

        // TODO: code to render the widget, e.g.
        el.innerText = x.message;

      },

      resize: function(width, height) {

        // TODO: code to re-render the widget with a new size

      }

    };
  }
});
If you are new to JavaScript, this code may look a bit strange. We see that factory is a method, but the return type is not a simple value. What’s with that?
The construction above is a design pattern that software engineers call a factory method. This pattern contains a method that returns an object instance. That may sound complicated, so let’s dig a little deeper to see what it means.
In more general terms, a factory method like this:
factory: function () {return {
  a: function() { ... },
  b: function() { ... }
}};
is equivalent to:
// factory is a method of some object
factory: function () {

  // define a new object
  var obj = new Object();

  // create a method a for it
  obj.a = function() { ... };

  // create a method b for it
  obj.b = function() { ... };

  // return the object instance
  return obj;
}
Hence, in our case, the factory method in HTMLWidgets.widget returns an object of the widget instance. This object itself has two methods i.e. renderValue, which draws our widget, and resize, which resizes the widget (if necessary).
In the implementation above, renderValue and resize are both implemented as closures, which means that the functions remember the scope they were created in and have access to the variables defined in that scope. A more in depth discussion on JavaScript closures is offered here. Of note, the concept of closures also exists in R, see here.
The implication of renderValue and resize being closures is that they have access to the el, width and height parameters passed to factory. Furthermore, we can initialize variables in the body of factory (above the definitions of renderValue and resize) that we want to use during the lifetime of our widget.
Now that we have a better understanding of what our HTMLWidgets.widget function is doing, let’s add some transitions to our gauge widget!
Even though the gauge widget from the first tutorial works, we can improve it. The current widget always creates a completely new gauge if we send it a value via shiny (using the renderC3Gauge function, see tutorial 1). It would be nicer if the widget used an animation to smoothly transition from its old state to its new state, as in the example at the top of the page. Luckily, C3 can create such transitions automatically. To take advantage of this, we will have to modify the code of our factory method.
In pseudo code, our new factory method will looks something like this:
factory: function(el, width, height){

  // we can define any variables we wish to use to keep track of the state of the widget here
  // lets create an empty chart
  var chart = null;

  return {
      renderValue: function(x) {

        // check if the chart exists
        if(chart === null){

           // the chart did not exist and we want to create a new chart
           chart = createChart(x);

           // store the chart on el so we can get it later
           el.chart  = chart;
        }

        // at this stage the chart always exists
        // get the chart stored in el and update it
        el.chart.updateChart(x);

      }
  }
}
To understand the pseudo code, it is helpful to realize that there are two basic stages in the lifetime of a chart:
The factory method has three arguments: el, width and height. Here el is the container element created by htmlwidgets in which we will house our chart. On top, we create a variable called chart, which we initially set to null, indicating that the chart does not yet exist.
Inside the renderValue method, we first check if the chart exists. If the chart does not exist, we create a chart via the toy function createChart, which in this case uses information in x. Subsequently, we store the chart on el, so we can access it later.
Technically, the closure allows us to render the chart even in the first line, i.e. at the line var chart = null;. In C3, however, we often need information stored in x to create a chart. Note that x contains the data and chart options passed via shiny from R to JavaScript (using jsonlite, see tutorial 1). As C3 often needs information in x during initialization, here we initialize the chart inside the renderValue method and subsequently check if the chart was already created. This is slightly inelegant, however, it is quite easy and the overhead is minimal.
Note that the chart will exist in all subsequent calls to renderValue. In those instances, we first retrieve the chart via el, which we can access because renderValue is a closure. Second, we call an update method on the chart, which will again use information stored in x.
Let’s convert the previous pseudo code into actual code for our gauge!
The next JavaScript code block shows how we can load new data into a C3 based chart created via c3.generate.
var chart = c3.generate({
  // chart code here
  ...
});

// some data
var newData = 50;

// load data into the chart
chart.load({
  json: newData
});
If we combine this code snippet with the previous factory pseudo code we end up with the code we’re looking for:
HTMLWidgets.widget({

  name: 'C3Gauge',

  type: 'output',

  factory: function(el, width, height) {

    // create an empty chart
    var chart = null;

    return {

      renderValue: function(x) {

        // check if the chart exists
        if(chart === null){

          // the chart did not exist and we want to create a new chart via c3.generate
          chart = c3.generate({
                bindto: el,
                data: {
                    json: x,
                    type: 'gauge',
                },
                gauge: {
                    label:{
                        format: function(value, ratio){ return value;}
                    },
                    min: 0,
                    max: 100,
                    width: 15,
                    units: 'value'
                }
            });

          // store the chart on el so we can get it later
          el.chart = chart;
        }

        // at this stage the chart always exists
        // get the chart stored in el and update it
        el.chart.load({json: x});

      }
    };
  }
});
Of note, for brevity here we omitted the resize method (which is optional).
You can find the complete code for the updated gauge widget, as well as the code for the widgets below at this repo, which contains a C3 package. The C3 package contains updated code for the gauge widget, a pie chart widget, a combination bar + line chart and a stacked area chart. The code of the latter three widgets is discussed in detail below. The R code of these widgets can be found here. The JavaScript and YAML files for each widget are located here.
You can install the updated C3 package by running the following command in R:
devtools::install_github("FrissAnalytics/shinyJsTutorials/tutorials/materials2/C3")In order to help you understand the various C3 widgets in this tutorial, we’ve built a shiny C3 demo app that shows how you can use these widgets in a shiny context. You can download this dashboard here. To see the app in action press the screenshot below! In the next tutorials we will extend the capabilities of these widgets even further when we take a closer look at JavaScript events.
We show you how to create the widgets below, which you can subsequently render with C3Gauge,C3Pie,C3LineBarChart, and C3StackedAreaChart.
In a shiny app (in ui.r), these functions are paired with the output functions: C3GaugeOutput, C3PieOutput, C3LineBarChartOutput, C3StackedAreaChartOutput, and (in server.R) with the render functions: renderC3Gauge, renderC3Pie, renderC3LineBarChart, renderC3StackedAreaChart.
Note that you can also use the widgets in a Markdown document as well!
You can also experiment with code changes right in the browser with an online htmlwidget fiddle app, as discussed in the next section.
It can become a bit cumbersome to build, install and load a package each time you want to test something, especially if you just want to play around with an example and experiment to find out how something works. For the purpose of this tutorial series, we created a small helper online app similar to a JavaScript fiddle. You can use the app to change code and immediately see the impact. You can find the online app here.
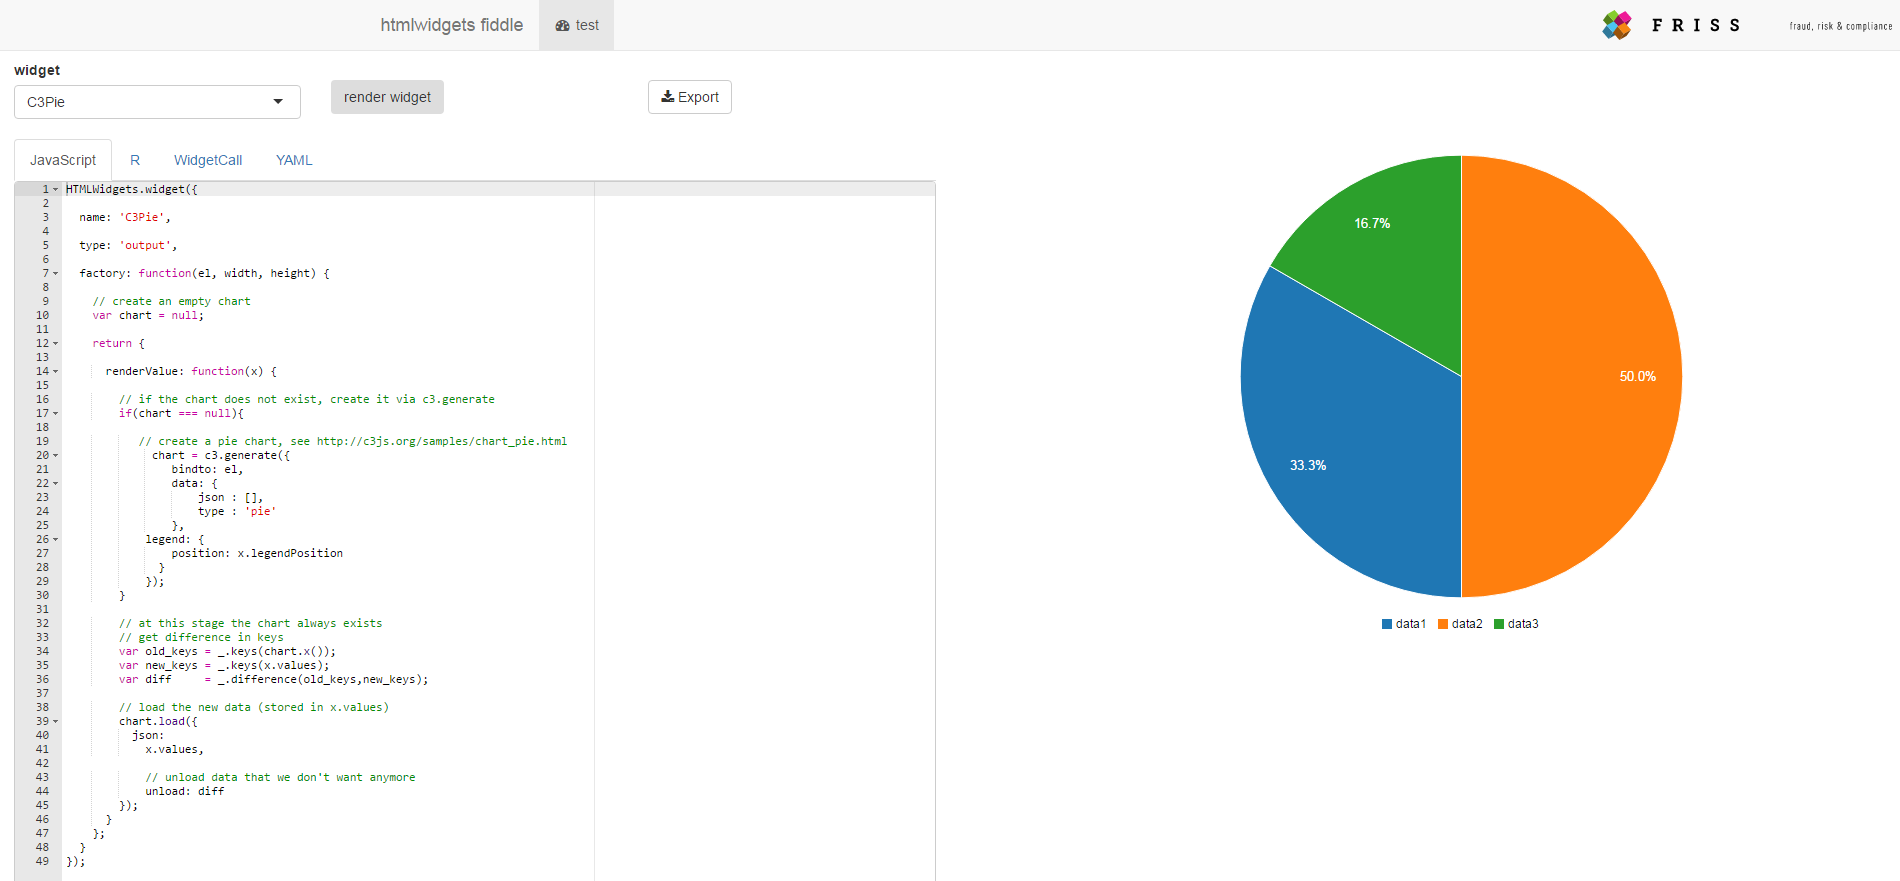
All widgets in this tutorial series are available in the app. You can select a widget in the drop-down list after which its JavaScript code, R code, and YAML contents are loaded in the corresponding tabs. You can then play around with code changes and see the effect by pressing the ‘render widget’ button. In the Widgetcall tab, you can add your own data and provide the widget render call.
You can also export the code as a zipped R package, which can be installed by opening the .Rproj file in RStudio and running devtools::install(). Currently, the functionality of this app is limited to rendering C3 based charts. We plan to update the functionality of this app during the course of the tutorial series, i.e. by allowing you to add additional JavaScript and CSS files.
Now we’re all set, let’s make some more widgets!
The gauge is by far the most simple visualization C3 offers. More complex charts require more complex data objects. In C3, each data series is associated with a unique key. These keys help us to keep track of which data series are in the chart, which data parts need an update and which data we want to remove.
To be more specific, when C3 loads a new data set via the load method, it will overwrite data if the key you provide is already present. However, when the key is not already present, the data you provide for that key will be added to the data it already has! As a consequence, if you want to remove data, you’ll have to explicitly remove it for a given key. To illustrate this process, consider the following example.
Assume we have the following data: {key1 = 10, key2 = 25}, and in a next step we want to use: {key1 = 20, key3 = 30}. Notice that in the new data key2 is not present. Without unloading, loading the new data set will result in the data {key1 = 20, key2 = 25, key3 = 30}. In this case C3 updates the data for key1, retains the data for key2, and adds the data for key3. In order to make the correct update, we need to remove the data for key2, which we can do via an unload statement (see below).
With the gauge chart fully handled, let’s create a C3 based pie chart with animated transitions! Just like in our first tutorial, let’s first take a look at the HTML and JavaScript code via a JSfiddle.
The steps for creating other C3 widgets are very similar to the process described for the gauge widget. In the remainder of the tutorial, we will therefore focus on complete code segments for the R and JavaScript parts, in which various parts are explained via code comments inside the code blocks.
In the charts below, we use various C3 specific chart options. A complete overview of all these options (including additional classes & methods) can be found in the C3 reference. In addition, the complete R, YAML and JavaScript code for all the widgets constructed in this tutorial can be found here.
Similar to the first tutorial, we can create the template code for a C3 pie widget via the R command:
htmlwidgets::scaffoldWidget("C3Pie", edit = FALSE)This command creates a C3Pie.js and C3Pie.yaml file in the inst/htmlwidgets folder and a C3Pie.R file in the R folder of your package (see tutorial 1).
The R part of our code looks like this:
C3Pie <- function(values, legendPosition = "bottom", width = NULL, height = NULL) {

  # forward options using x
  x = list(
    values = values,
    legendPosition = legendPosition
  )

  # create widget
  htmlwidgets::createWidget(
    name = 'C3Pie',
    x,
    width = width,
    height = height,
    package = 'C3'
  )
}
Note that we added two arguments i.e. values, which contains the individual pie values and legendPosition, which takes as values ‘bottom’, ‘right’, and ‘inset’ (see here).
As before, all data is passed from R by the variable x, which is a list. Subsequently, shiny will tacitly pass this object via the R package jsonlite, to JavaScript. Remember, after this step we are talking about a JavaScript object, which is very different to the R object you started with. As noted before, this step is one of the hardest (and often most confusing) steps in creating htmlwidgets.

Back to our widget, in JavaScript, we can subsequently access the two variables from above via x.value and x.legendPosition, respectively. In the R code above, values is a list object. For instance, we can specify the pie data as list('data1'=30,'data2'=120).
As noted in the tutorial 1, it is worthwhile to experiment with jsonlite to see how R structures are converted from R to JavaScript.
For instance, in R run:
jsonlite::toJSON(list('data1'=30,'data2'=120)){"data1":[30],"data2":[120]} The output results in {"data1":[30],"data2":[120]}. Aside from the extra brackets, the output looks like the structure we would like to have. The extra brackets imply an array with a single value, which for this purpose is the same as a single number.
The JavaScript code for our pie widget looks like this:
HTMLWidgets.widget({

  name: 'C3Pie',

  type: 'output',

  factory: function(el, width, height) {

    // create an empty chart
    var chart = null;

    return {

      renderValue: function(x) {

        // if the chart does not exist, create it via c3.generate
        if(chart === null){

           // create a pie chart, see http://c3js.org/samples/chart_pie.html
             chart = c3.generate({
                bindto: el,
                data: {
                    json : [],
                    type : 'pie'
                },
            legend: {
                position: x.legendPosition
              }
            });
        }

        // at this stage the chart always exists
        // get difference in keys
        var old_keys = _.keys(chart.x());
        var new_keys = _.keys(x.values);
        var diff     = _.difference(old_keys,new_keys);

        // load the new data (stored in x.values)
        chart.load({
          json:
            x.values,

            // unload data that we don't want anymore
            unload: diff
        });
      }
    };
  }
});
In the JavaScript code above, just before the chart.load command, we compute the difference between keys in the old (current) data and the new data. In R, computing set differences is easy via setdiff. However, this function is not available in JavaScript, so how can we compute this difference?
Luckily, in JavaScript there are many tool-belt helper libraries that offer handy functions for manipulating data. A popular library worth checking out is underscore, which we use to help us work with data keys. Here we used the underscore functions _.keys and _.difference. Via _.keys we extract the key information out of the appropriate objects and via _.difference we compute the set difference:
  var old_keys = _.keys(chart.x());
  var new_keys = _.keys(x.values);
  var diff     = _.difference(old_keys,new_keys);
Notice that all of the functions in underscore start with a _, hence the name. You don’t need a complete understanding of the last code snipped to follow the rest of this tutorial, but we highly recommend you check out what underscore can do, as being able to work with JavaScript objects and arrays is really helpful in building widgets!
For the remaining two charts (discussed below) we use the same concept, but the objects we put in _.keys are slightly different.
Finally, the YAML file for our pie widget looks like this:
dependencies:
- name: d3
  version: 3.5.0
  src: htmlwidgets/lib/d3
  script: ./d3.min.js
- name: c3
  version: 0.4.10
  src: htmlwidgets/lib/c3
  script: ./c3.min.js
  style: ./c3.min.css
- name: underscore
  version: 1.8.3
  src: htmlwidgets/lib/underscore
  script: ./underscore-min.js
Note that we added a reference to underscore.
You can test drive the C3 pie widget via:
C3Pie(values=list(data1=200,data2=300,data3=100))Instead of creating a single chart, like a line chart or a bar chart, C3 allows you to create combination charts that combine several chart types into a single chart.
In this segment, we will combine a bar chart with a set of line charts. In addition, we’ll add a sub-chart to it which we’ll use in a later tutorial to create a time based filter.
Looking at the fiddle, you can see we have a lot more options to deal with. To keep things simple, we’re not going to parameterize all of them. In the widget below, the user provides a single dataframe called dataset, with a time column (used for the x-axis) and a set of additional columns (used as y-values) for the bar and line series. Furthermore, the user must specify a colors variable that holds the display colors for the bar and line charts.
Here’s the complete R code for our C3LineBarChart widget:
C3LineBarChart <- function(dataset, colors, width = NULL, height = NULL) {

  # forward options using x
  x = list(
    dataset  = dataset,
    colors   = colors
  )

  # create widget
  htmlwidgets::createWidget(
    name = 'C3LineBarChart',
    x,
    width = width,
    height = height,
    package = 'C3'
  )
}
From the JSfiddle we can see C3 want the data in this format:
var dataSet = [
        {"Time":"2016-01-01","GREEN":1,"RED":2,"Total":3},
        {"Time":"2016-01-02","GREEN":4,"RED":5,"Total":6},
        {"Time":"2016-01-03","GREEN":7,"RED":9,"Total":9}
];
From R, we can obtain this format by providing the data as a dataframe. Let’s test this assertion with jsonlite:
    dataset <- data.frame(Time  = c("2016-01-01","2016-01-02","2016-01-03"),
                          GREEN = c(1,4,7),
                          RED   = c(2,5,9),
                          Total = c(3,6,9) )

    jsonlite::toJSON(dataset)
[{"Time":"2016-01-01","GREEN":1,"RED":2,"Total":3},{"Time":"2016-01-02","GREEN":4,"RED":5,"Total":6},{"Time":"2016-01-03","GREEN":7,"RED":9,"Total":9}] Nice, precisely what we need!
The complete JavaScript code for our C3LineBarChart looks like this:
HTMLWidgets.widget({

  name: 'C3LineBarChart',

  type: 'output',

  factory: function(el, width, height) {

    // create an empty chart
    var chart = null;

    return {

      renderValue: function(x) {

        // if the chart does not exist, create it via c3.generate
        if(chart===null){

            keys = _.keys(x.dataset);

            chart = c3.generate({

              // specify the container element we want the chart to render in
                bindto: el,
                data: {

                  // intialize with an empty array
                    json: [],
                    keys: {
                          // use Time for x-axis
                          x: "Time",

                      // use the remaining data for y-values
                        value: keys,
                    },

                    // set chart types
                    types: {

                    // default is line, we want totals to be displayed as bars
                        Total: 'bar'
                    },
                    axes: {
                      // extra y-axis
                        Total: 'y2'
                    }
                },
                axis: {
                    x: {
                      //  x axis as timeseries
                        type: "timeseries",

                        // tick format x-axis
                        tick: {
                            format: "%Y-%m-%d"
                        }
                    },
                    y2: {
                      // we want a second y-axis
                        show: true
                    }
                },

                // display a subchart - this will be used for brushing in a later stage
                subchart: {
                    show: true
                }
            });
        }

        // at this stage the chart always exists
        // get difference in keys
        var old_keys = _.keys(chart.x());
        var new_keys = _.keys(x.dataset);
        var diff     = _.difference(old_keys,new_keys);

        // update the data and colors
        chart.load({
          json  : x.dataset,
          colors: x.colors,

          // unload data that we don't need anymore
          unload: diff
        });
      }
    };
  }
});
As you can see, this code is a bit more involved. However, for the most part, we are only specifying specific C3 options. An overview of the complete set of available options can be found in the C3 reference.
The concept of rendering this chart is the same as for the pie chart. We make sure we hand the data to JavaScript in the correct format, we initialize a chart with an empty array, we compute any differences in keys relevant to unloading specific series and then we load and unload data.
You can build your practical experience by using our htmlwidgets fiddle app to experiment with creating and setting options for C3 charts. When you do this, its probably best to keep a separate tab open with the C3 reference.
Of note, we will use the sub-chart we created here in a later part of the tutorial series to pick up brush events and to send information back to shiny so we can create a brush-able time based filter.
Finally, the YAML file for this widget is the same as for our pie chart.
When we install our C3 package, we can create a C3LineBarChart via:
dataset <- data.frame(Time=c("2016-01-05","2016-01-12","2016-01-24"),
                      GREEN=c(0.1,0,0.2),
                      RED=c(0.9,1,0.8),
                      Total=c(320,210,190))
colors      <- list(Total="gray",GREEN="Green",RED="Red")
C3LineBarChart(dataset = dataset,colors=colors)Our last chart is very similar to the combination chart above. Here we create a C3 stacked area chart. As all of the concepts for this widget are repetitions from the previous charts, we keep the description of this widget brief. Here’s a fiddle showing how to code a C3 stacked area chart:
The corresponding R code for our stacked area chart widget looks like this:
HTMLWidgets.widget({

  name: 'C3StackedAreaChart',

  type: 'output',

  factory: function(el, width, height) {

    // create an empty chart
    var chart = null;

    return {

      renderValue: function(x) {

        // if the chart does not exist, create it via c3.generate
        if(chart===null){

          var keys = _.keys(x.dataset);

            chart = c3.generate({
                bindto: el,
                data: {
                    json: [],
                    keys: {
                        x: "Time",
                          value: keys,
                    }
                },
                axis: {
                    x: {
                        type: "timeseries",
                        tick: {
                            format: "%Y-%m-%d"
                        }
                    }
                }
            });

      }

      // at this stage the chart always exists
      // get difference in keys
      var old_keys = _.keys(chart.x());
      var new_keys = _.keys(x.dataset);
      var diff     = _.difference(old_keys,new_keys);

      //chart.groups([x.groups]);

      // update the data
      chart.load({
        // new data
        json  : x.dataset,

        // new colors
        colors: x.colors,

        // remove data we no longer need (if any)
        unload: diff,

        // set types
        types : x.types
      });
    }
   };
}});
Finally, like before, the YAML file is similar to the one for the line bar chart and pie chart.
In R, the stacked area chart widget can be rendered via the following snippet:
dataset <- data.frame(
  Time  = c("2016-01-05","2016-01-12","2016-01-24"),
  GREEN = c(0.5,0.2,0.3),
  RED   = c(0.5,0.8,0.7))

colors  <- list(GREEN = "green", RED = "red")

C3StackedAreaChart(dataset,colors)
Note that we create a named list to set the colors such that the data keys line up with the display colors we want to use.
At this stage we have created code for all four widgets in the showcase dashboard app! In the next tutorial, we see how we can send messages from R to our widgets and back. The messages allow us to manipulate charts from R and to create linked visualizations in which one widget reacts to another widget.