Add Google Analytics
This article will show you how to add Google Analytics to a Shiny app. If you don’t know any JavaScript or jQuery, you can still add simple analytics by following the steps outlined in this article, but customizing the type of analytics you collect will require that you know a little about JavaScript and jQuery (which we will not teach here).
Google Analytics is a free service offered by Google that collects information about who visits your website and what they do while they are there. You can learn more about Google Analytics at support.google.com/analytics, which explains how to set up and use Google Analytics with a web page.
From time to time Google changes how they do content tracking. The following information is current as of August 2023. If you find that the information is out of date at any point, please let us know on RStudio Community.
Add analytics to an app
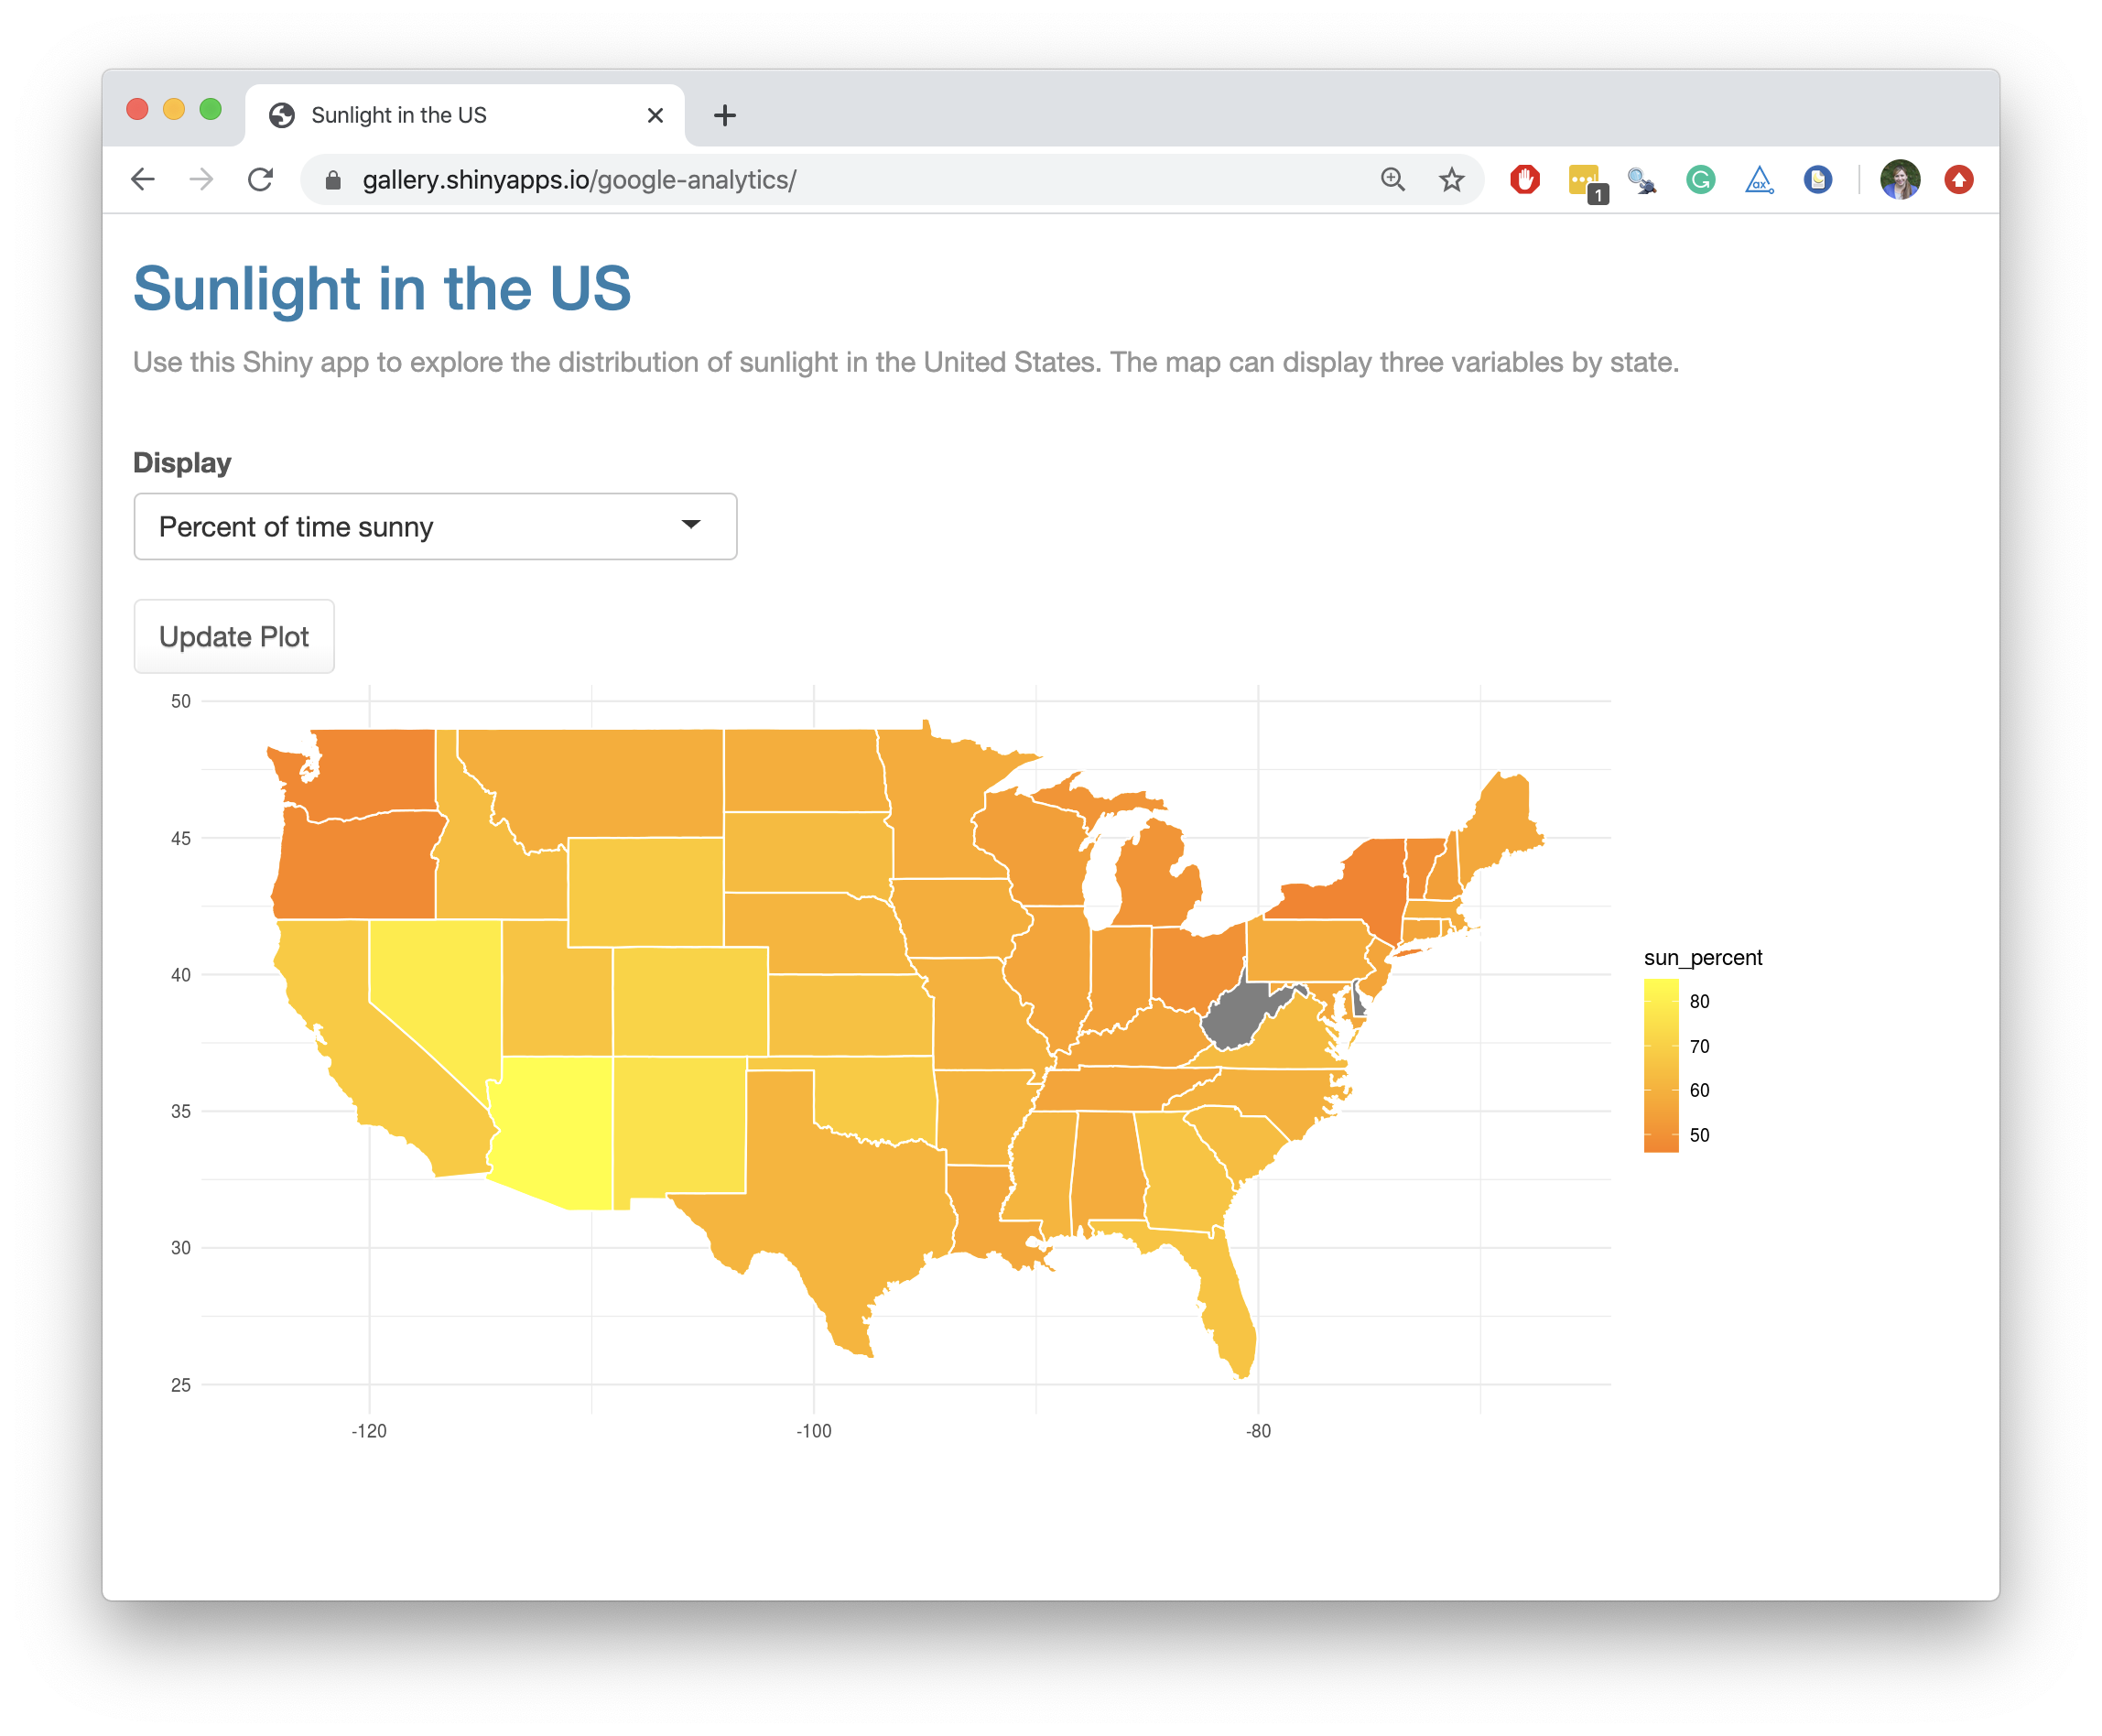
You can use Google Analytics with a Shiny app, since Shiny apps are a type of web page. In this article, we will add Google Analytics to the Sunshine app, pictured below.
The Sunshine app displays the distribution of annual sunlight in the United States. The app is hosted on shinyapps.io at gallery.shinyapps.io/google-analytics. If you’d like a copy of the app, including its JavaScript and CSS files, you can find them here.
You can add analytics to the app (and collect results) with the five steps below.
Step 1 - Create an account
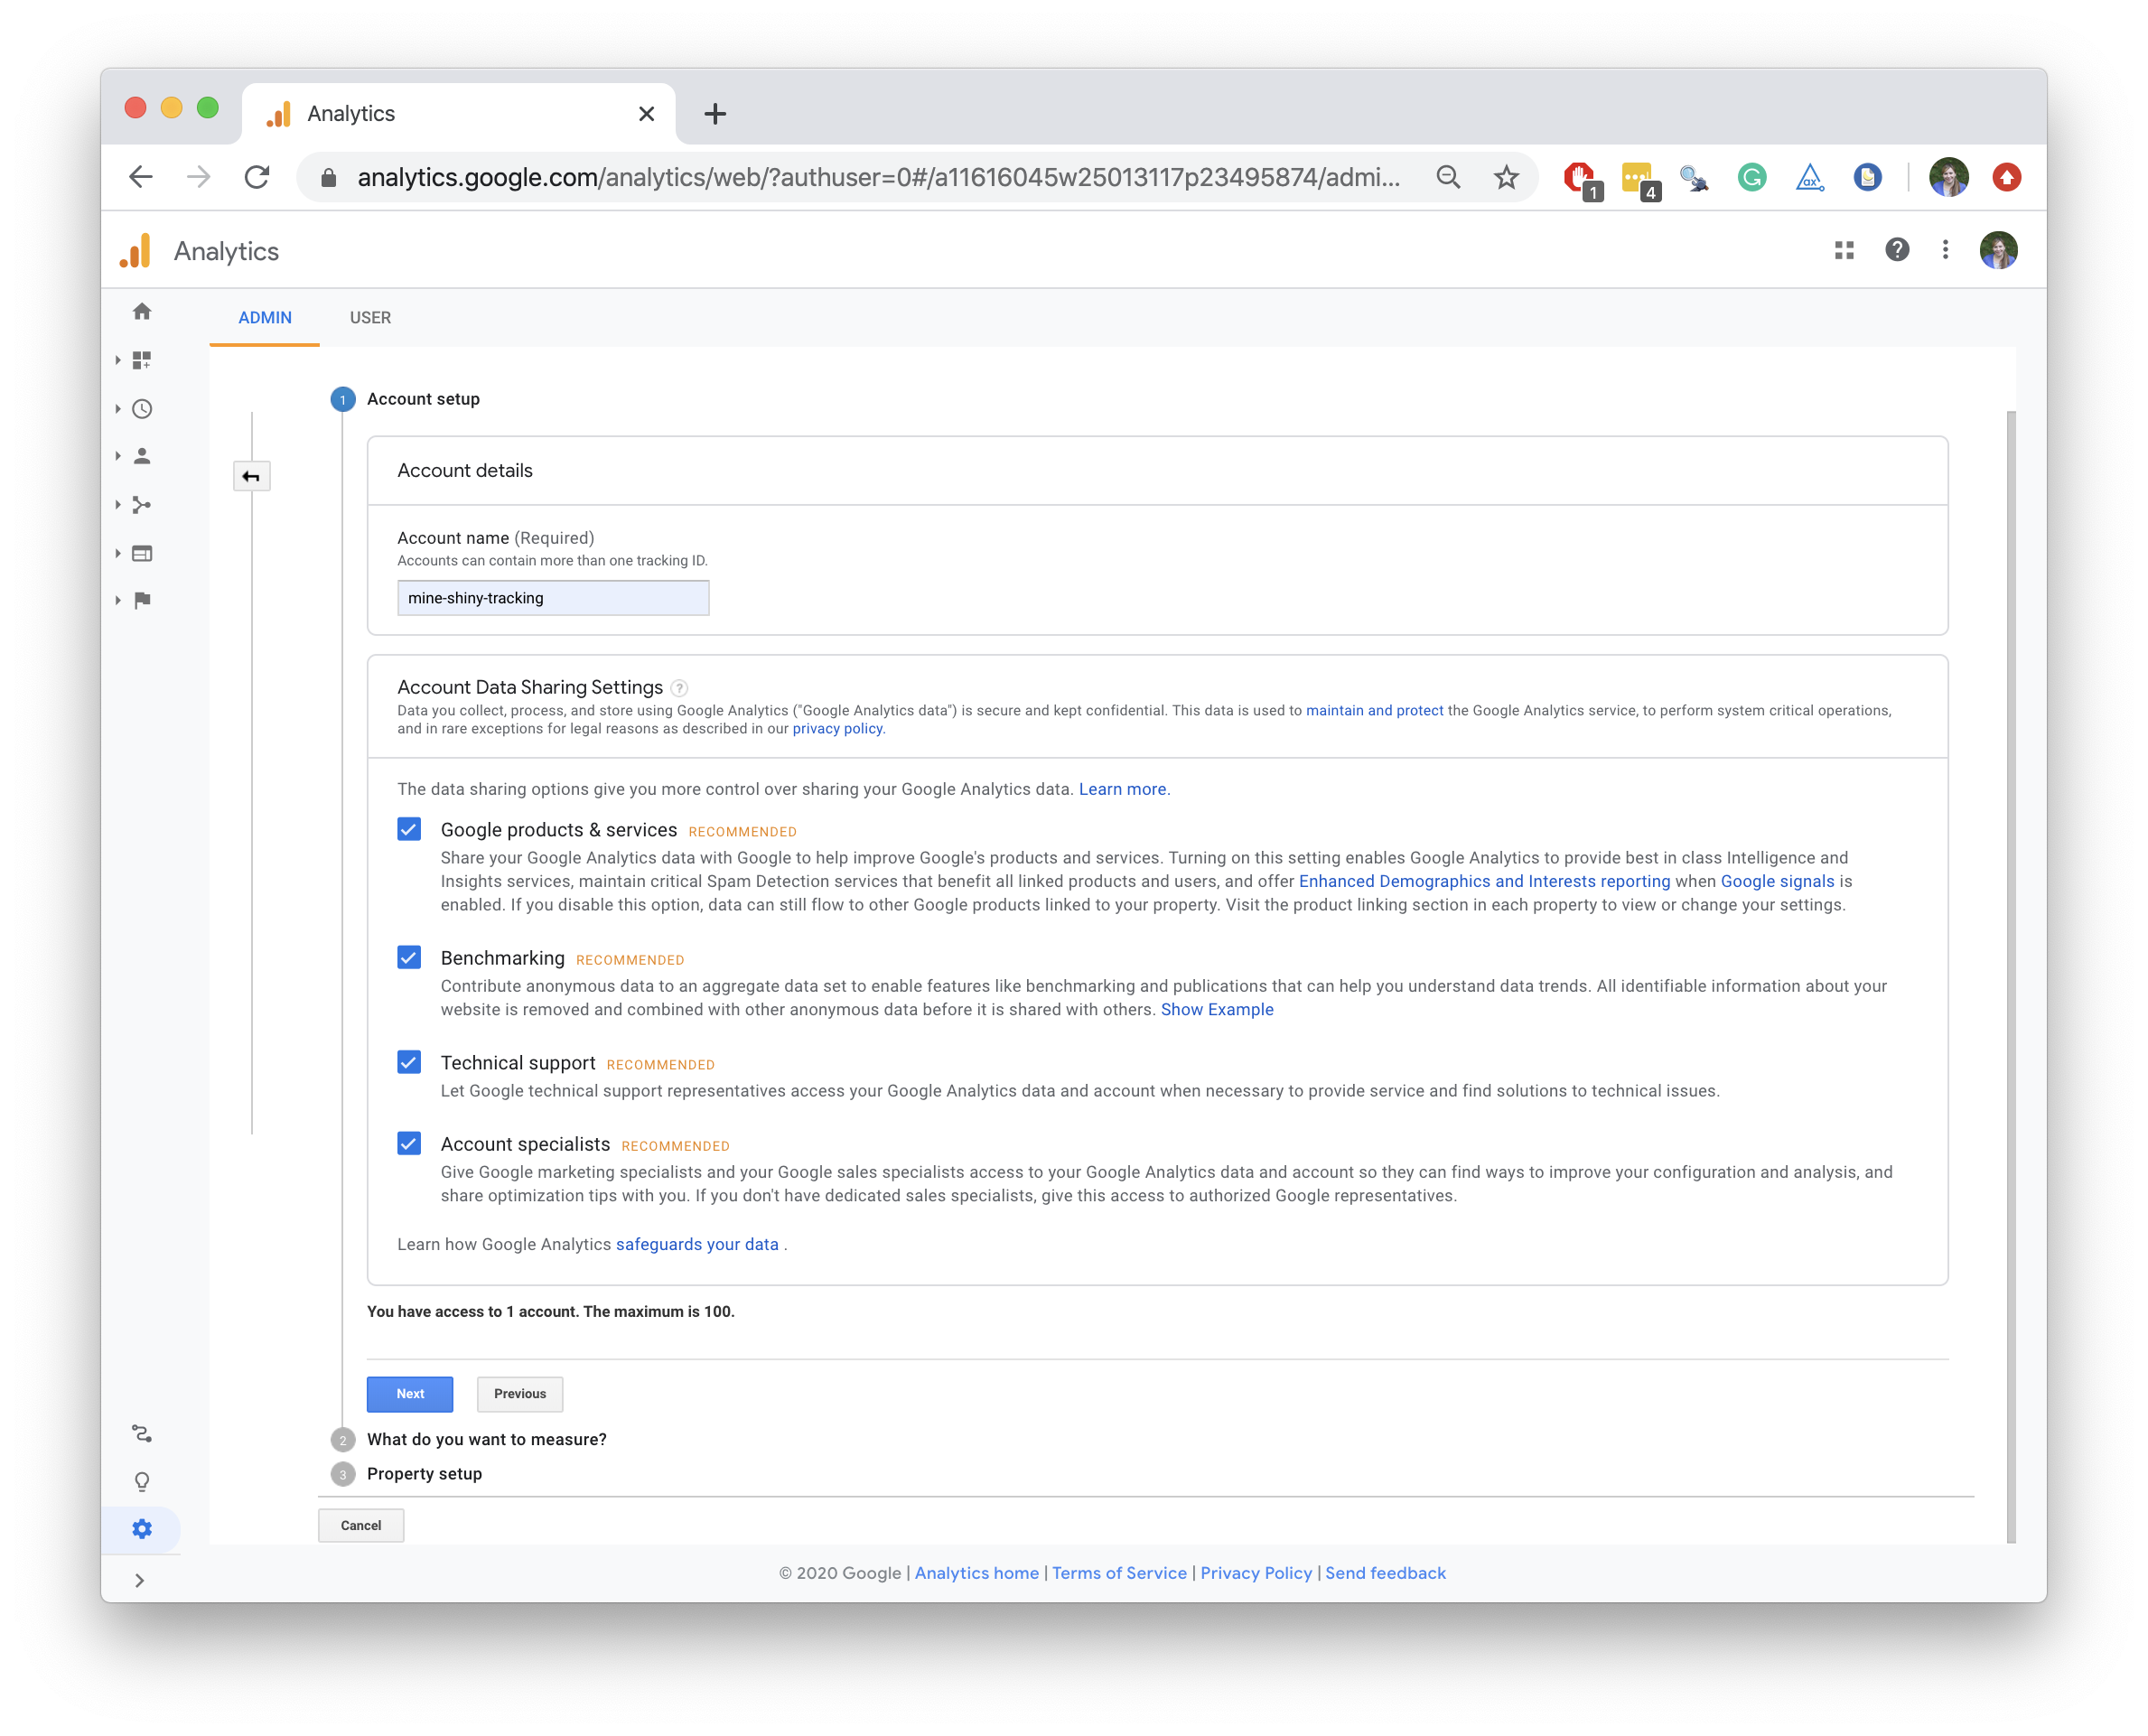
To use Google Analytics, you must open a free account at google.com/analytics.
Step 2 - Add a property
Next, you must register your Shiny app as a property in your Google Analytics account. You can do this on the sign up page, or—if you already have a Google Analytics account—you can do this in the Admin tab.
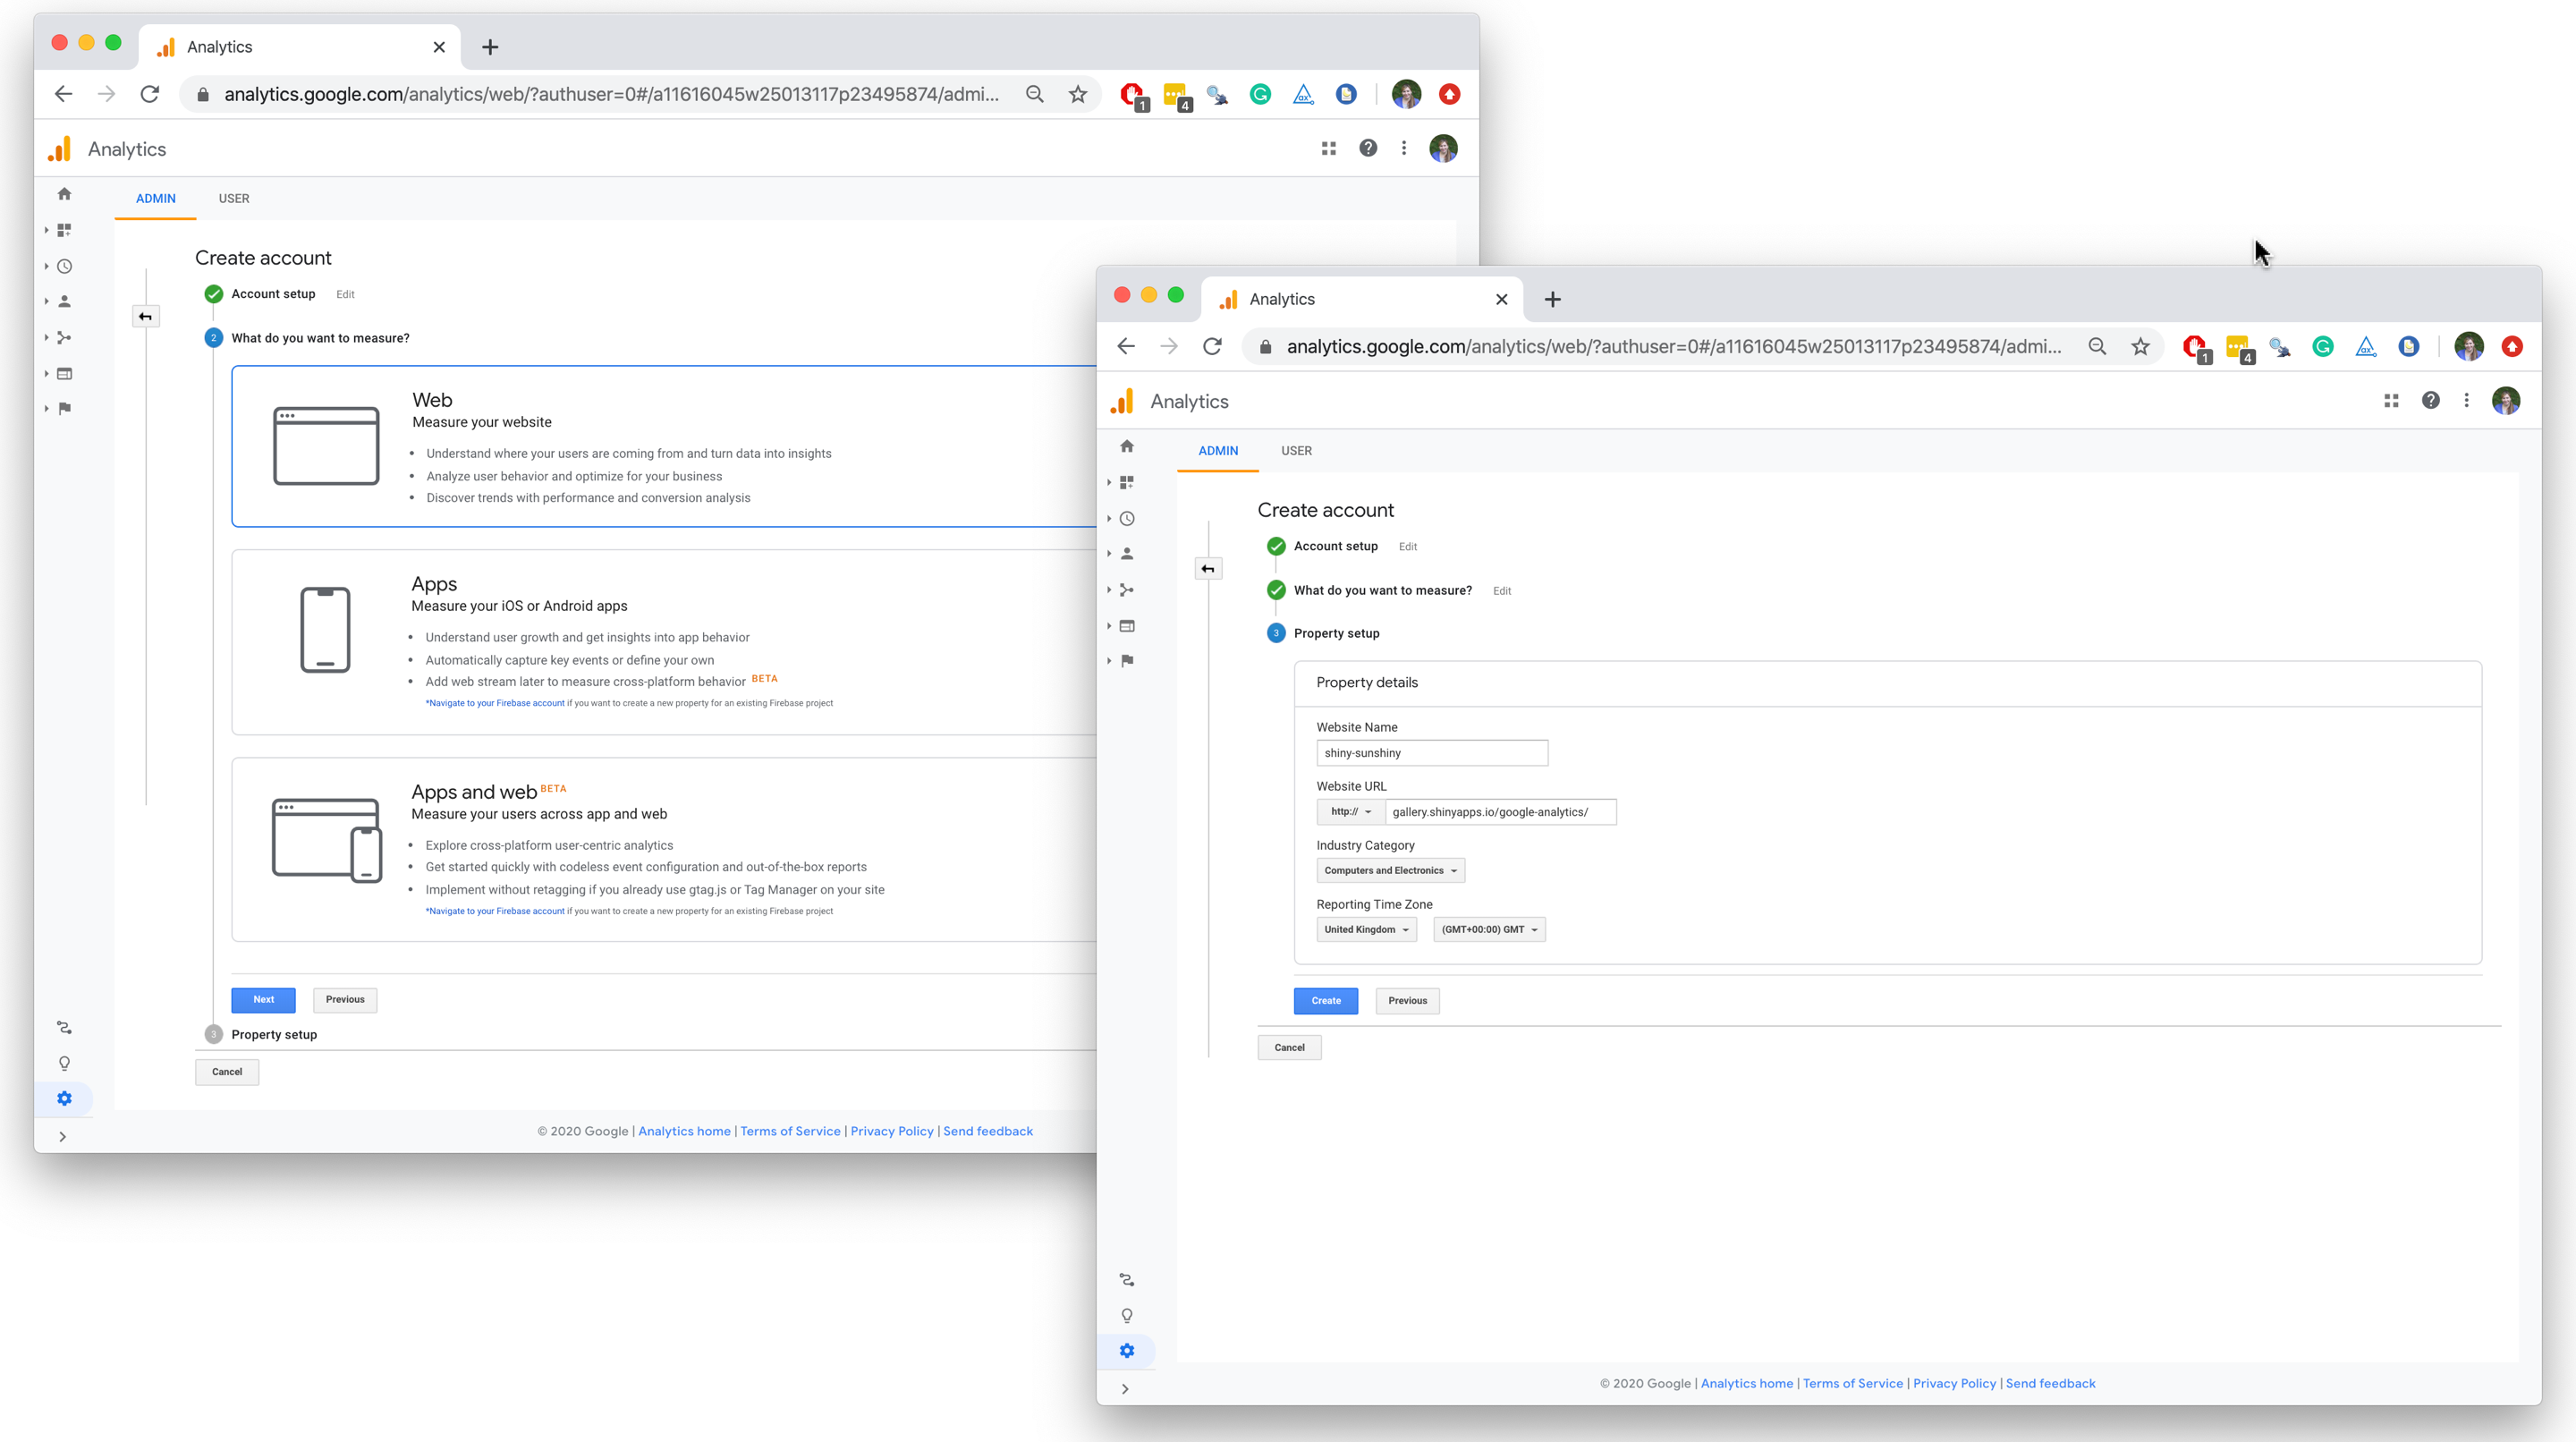
You will need to provide a web address for your app to Google Analytics. Since the Sunshine app is hosted at https://gallery.shinyapps.io/google-analytics, I’ll use this address.
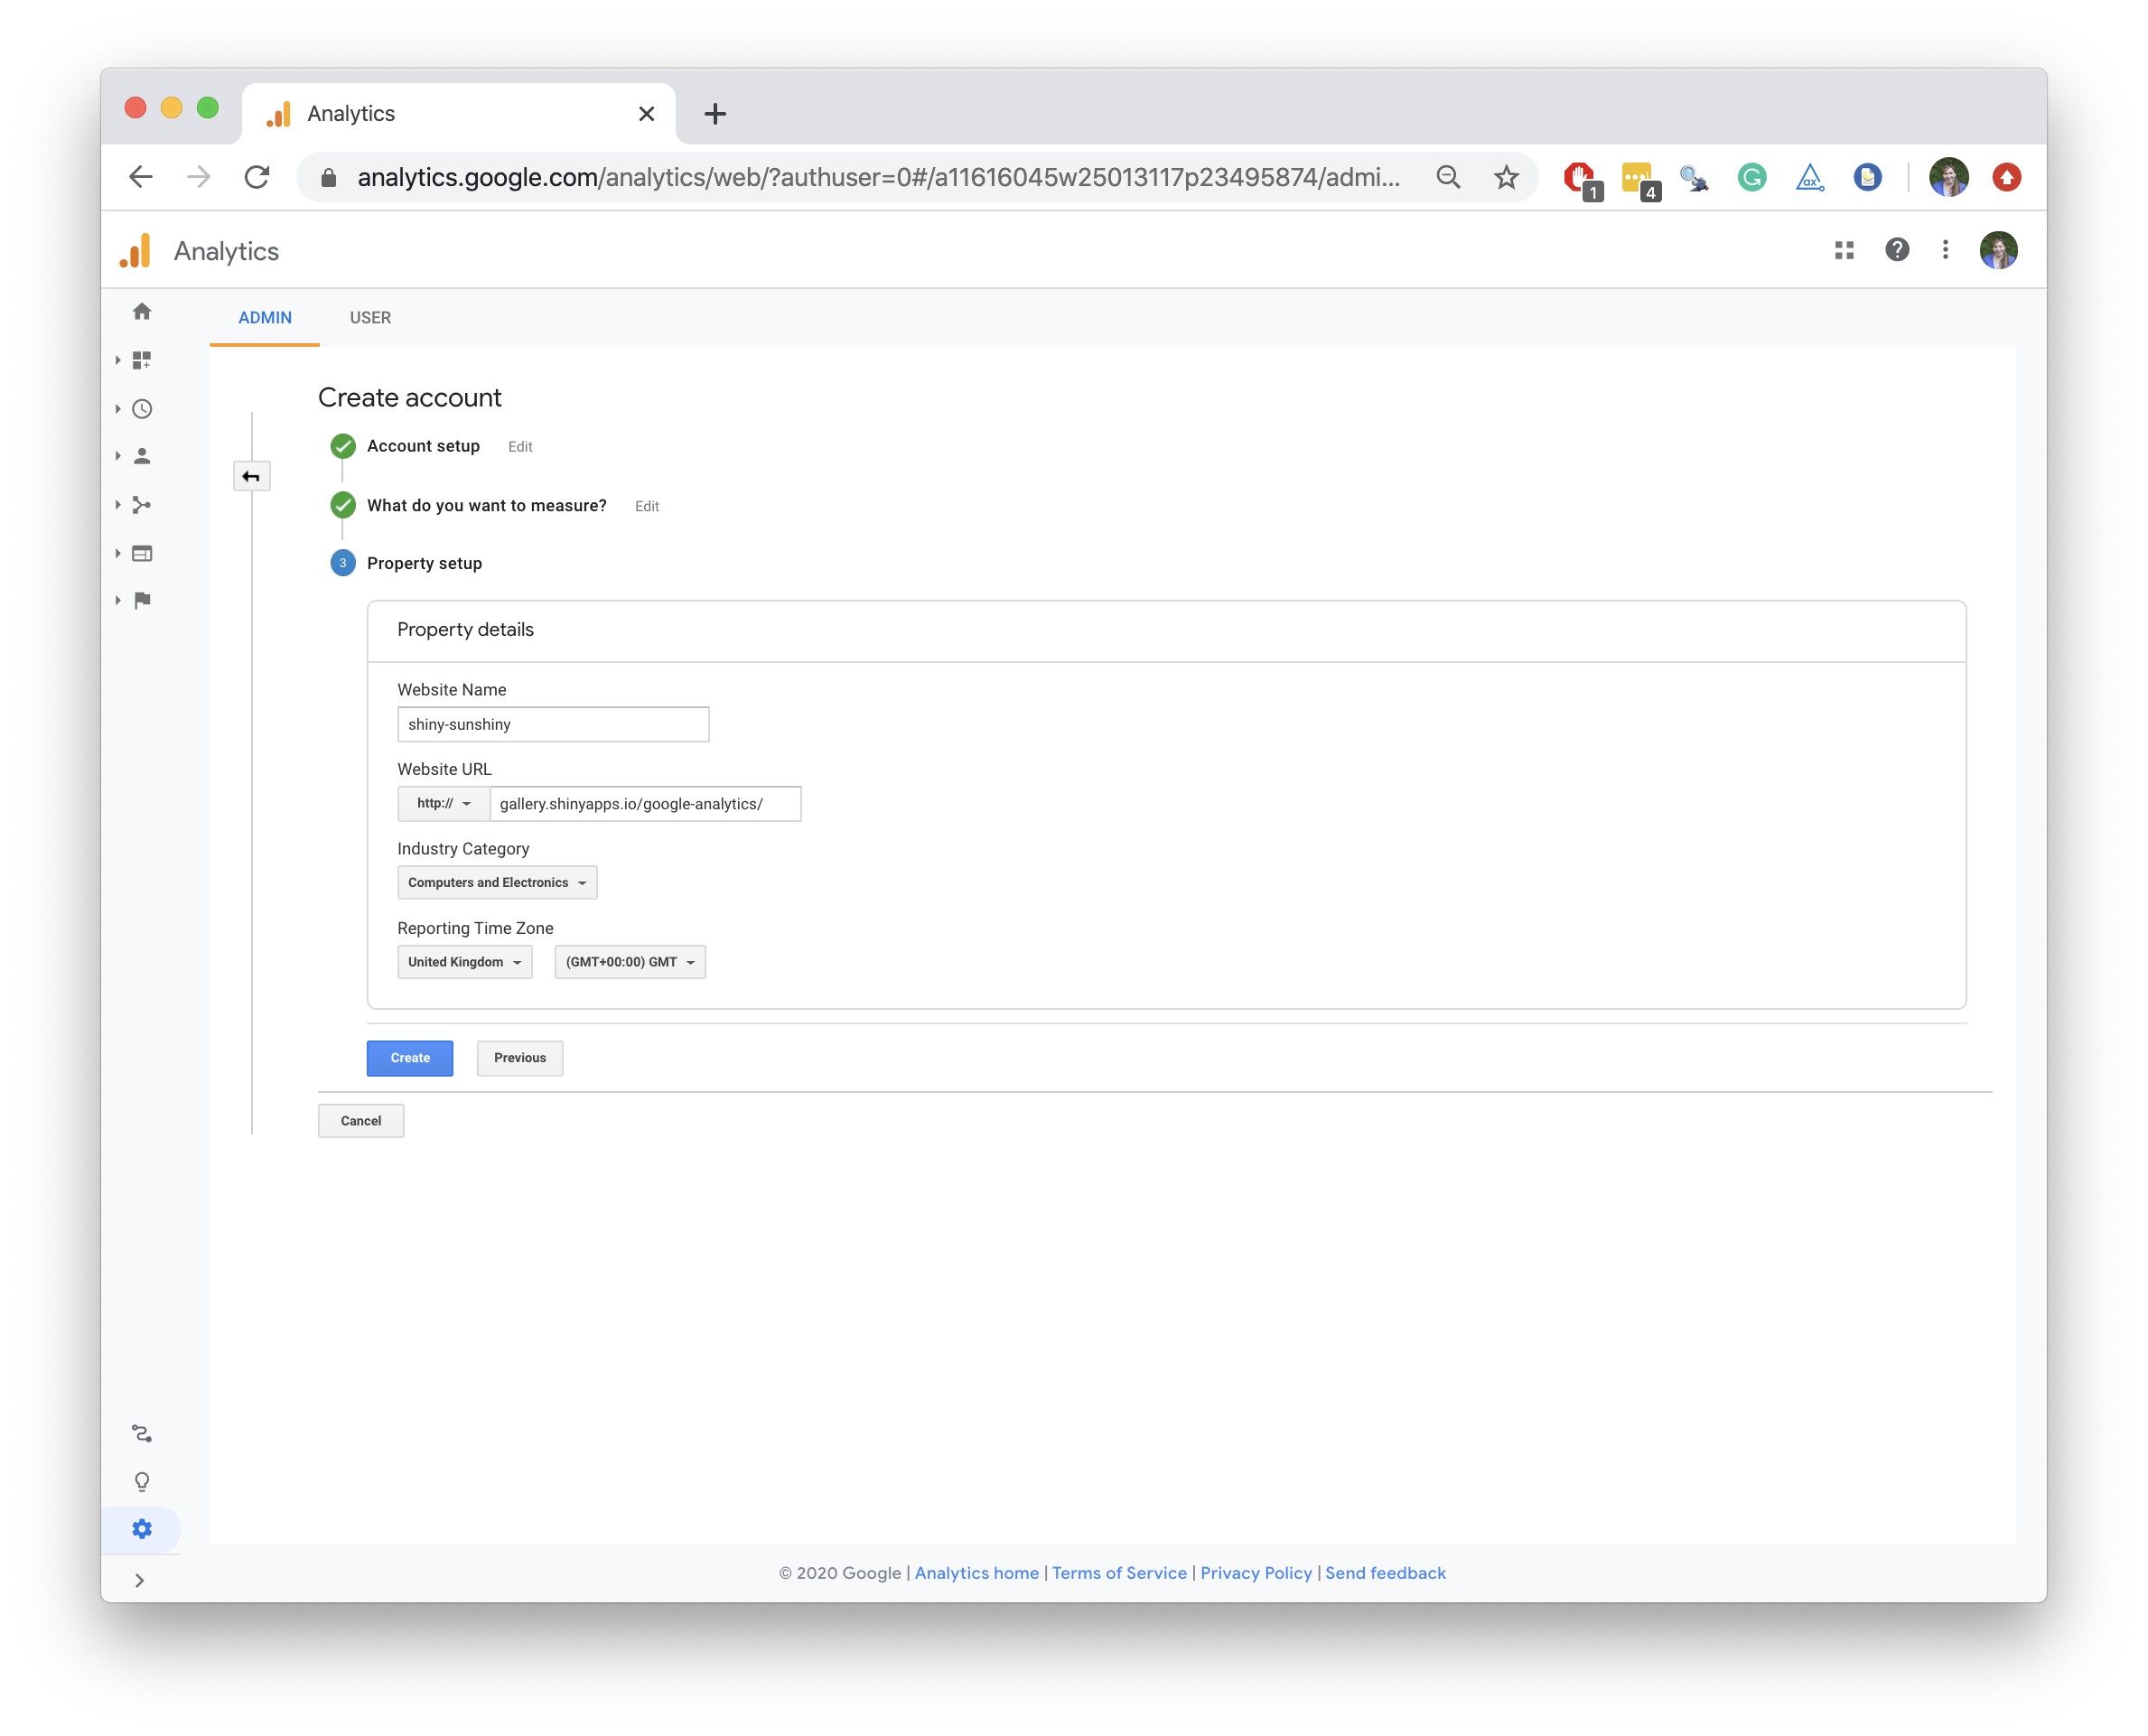
Once you have entered the necessary information, click “Create” at the bottom of the form. Google Analytics will open a new window that contains a tracking ID number for your app as well as a short JavaScript script.
![]()
This script will allow Google Analytics to track traffic to and from your app. To use it, you’ll need to put the script in the head of your app’s DOM, the subject of Step 3.
Step 3 - Embed tracking script
You should place the Google Analytics tracking script at the end of the head section of the HTML DOM that describes your Shiny app.
This is very easy to do if you build your Shiny app around an HTML file, as described in Build your entire UI with HTML.
If you built your Shiny app with a app.R file (the traditional method), use the tags$head and includeHTML functions to include the script.
For example, Google Analytics has given us the script below to embed in the Sunshine app. Note that your Google tag will be different from ours, which starts with GT- and is used in two places below. The Google tag is an identifier for the content you created on Google Analytics.
google-analytics.html
<!-- Global site tag (gtag.js) - Google Analytics -->
<script async src="https://www.googletagmanager.com/gtag/js?id=GT-XXXXXX"></script>
<script>
  window.dataLayer = window.dataLayer || [];
  function gtag(){dataLayer.push(arguments);}
  gtag('js', new Date());

  gtag('config', 'GT-XXXXXX');
</script>
To include the script in your app, first save it to its own file. Here I’ve saved the script as a file named google-analytics.html, which I have placed in the working directory of the Sunshine app.
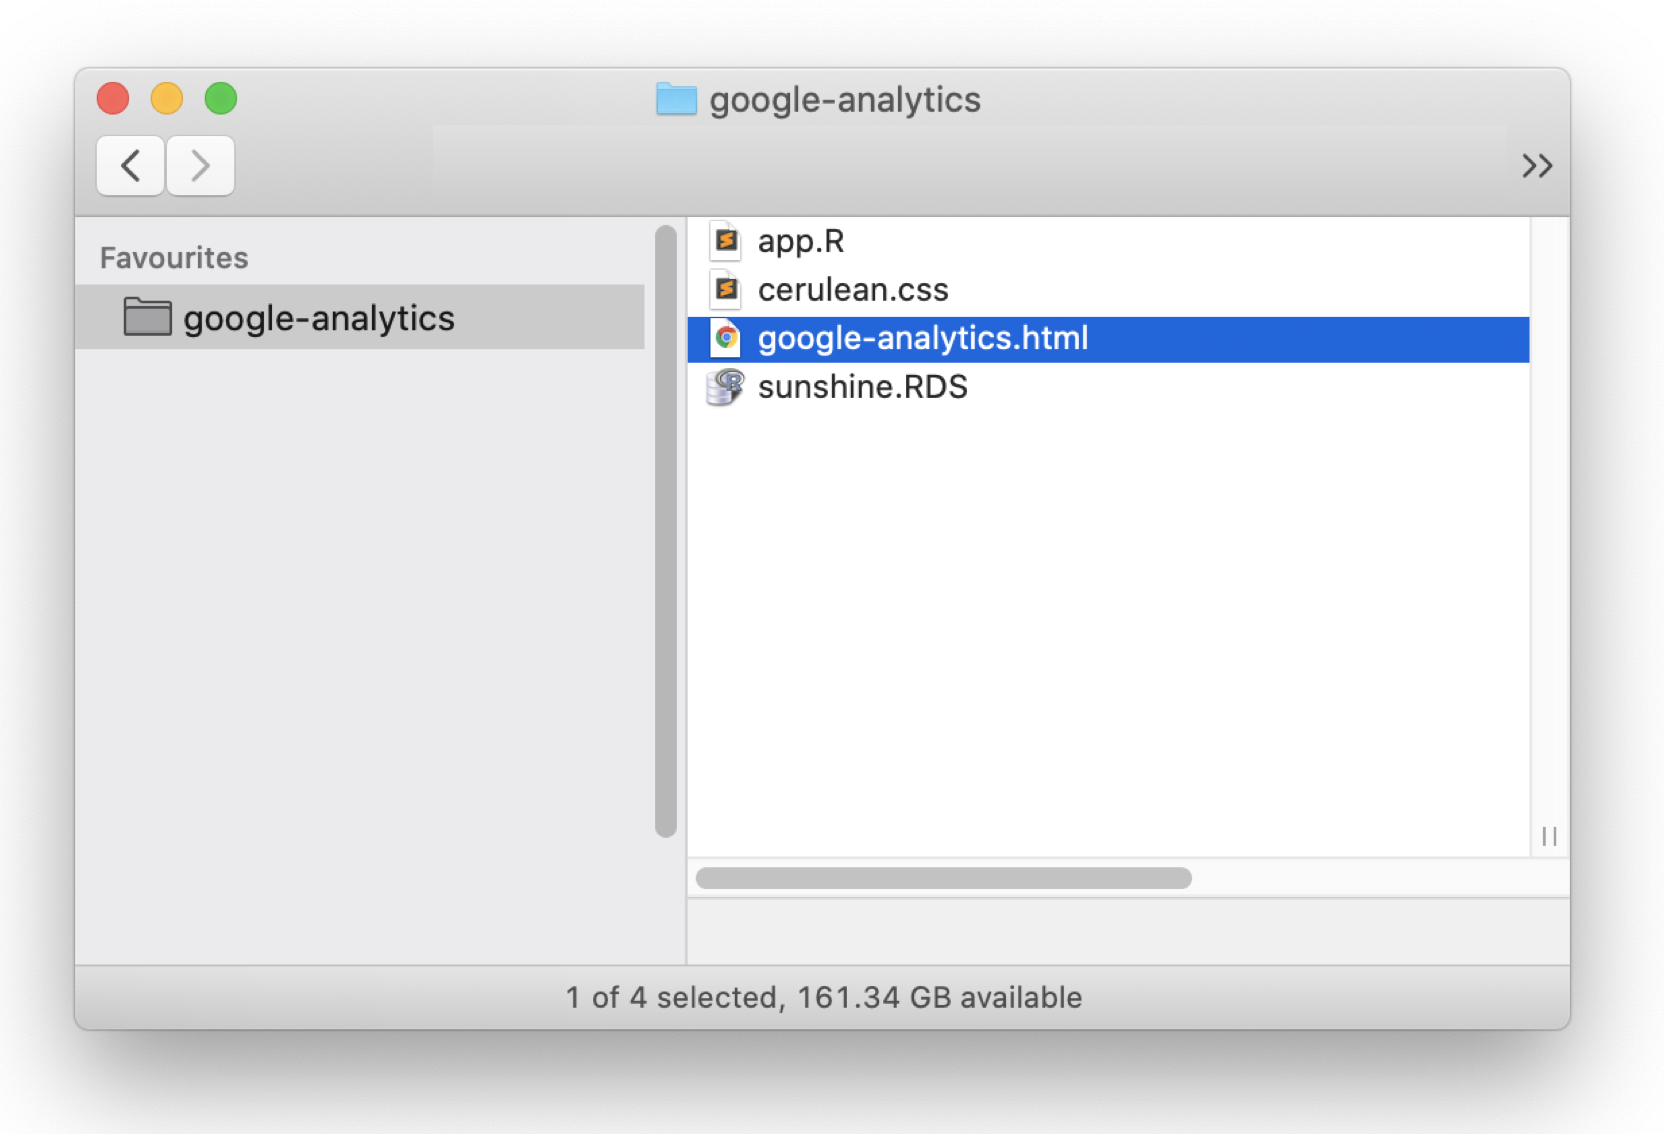
To embed the script in the Sunshine app, call tags$head(includeScript("google-analytics.js")) in the ui.R file. includeScript will import the script and pass it to tags$head(), which will place the script in the head section of your app’s DOM.
includeHTML requires one argument: "google-analytics.html", the file path from the App directory to the google-analytics.html file.
The final ui of my app will look like the following.
app.R
ui <- fluidPage(
  tags$head(includeHTML("google-analytics.html")),
  includeCSS("cerulean.css"),

  titlePanel("Sunlight in the US"),

  helpText("Use this Shiny app to explore the distribution of sunlight in
           the United States. The map can display three variables by state."),

  br(),

  selectInput("var", "Display",
    choices = c(
      "Percent of time sunny" = "sun_percent",
      "Annual hours of sunshine" = "total_hours",
      "Annual clear days" = "clear_days"
    )
  ),

  actionButton("update_plot", "Update Plot"),

  br(),

  plotOutput("map", width = "90%")
)
Since the app is hosted on shinyapps.io, I will need to redeploy the app to shinyapps.io for the new app.R file to take effect.
The Google Analytics script tracks how visitors move from one web page to the next. With it, you can learn a little about:
- who visits your app
- where they come from
- how long they stay on the app while they are there
You can also use Google Analytics to track how visitors use your app, but to do that you will need to set up specific event trackers.
Step 4 - Create event trackers
An event tracker is a piece of code that notifies Google Analytics whenever a visitor interacts with a specific part of your app, such as a link or a widget. You create a separate event tracker for each unique event that you want to track.
With Google Analytics, you use the basic script to track how people move to and from your page, and you use event trackers to track what they do while they are there. Note that you will need to embed the basic Google Analytics tracking script into your app before you create any event trackers. Event trackers will not work without the basic script.
To create an event tracker, you arrange to have a web element’s event handler execute a simple JavaScript command that looks like this:
gtag('event', 'action', { key: value });When the element executes the command, gtag sends an event notification to Google Analytics that lets Google Analytics know that an event occurred. The notification will contain the values of action and event data as a JavaScript object in the form key-value pairs. Later on, you will be able to see these values, as well as when the event occurred, from your Google Analytics dashboard.
For example, you can track when users click on a specific link by having the link’s onClick attribute call gtag:
<a href="http://www.example.com"
   onclick="tag('event', 'link', { action: 'click': label: 'IKnow' })">
   I know when you click me
</a>;
This works for tracking events on simple web elements, but you must use a different approach to track events on Shiny widgets.
Shiny does not let you set arbitrary attributes on widgets when you create them. To set an event tracker on a Shiny widget, you will need to identify and modify the widget after it has been created, which you can do with a jQuery script.
For example, the Sunshine app has two widgets: a select box and a button. I would like to track how users interact with each of the widgets. To do this I will need to create two event trackers, one for the select box widget and one for the button widget. I will also need to set these event trackers on the widgets with jQuery.

The following script attaches an event handler to the select box widget. The handler will execute for change events that occur on the widget. In other words, the tracker will notify Google Analytics whenever a visitor changes the value of the select box widget.
I’ve chosen to have the event report include “widget” for the category value and “select data” for the action value. The last argument will return the value of the new selection as the label argument. This tracker will not return a value value; value arguments are optional.
$(document).on('change', 'select', function(e) {
  gtag('event', 'widget', {
    action: 'select data',
    label: $(e.currentTarget).val()
  });
});
I can track the app’s “Update Plot” button in a similar way. The script below will send an event notification whenever a user clicks on a button class object in the DOM, e.g. the “Update Plot” button:
$(document).on('click', 'button', function() {
  gtag('event', 'button', { action: 'update plot' });
});
Note: to write effective jQuery code, you will need to be able to uniquely identify the widgets that you wish to track. This may require you to explore the document structure of the finished app, for example in your browser’s developer tools console.
When working with Shiny apps, use jQuery code that creates delegated event handling, like the code above does. Delegated events work more nimbly with the dynamic nature of Shiny apps than do direct events.
Now, that I’ve written the code that will allow event tracking, I need to add it to the app.R file of the Sunshine app. The easiest way to do this is to include the code in the google-analytics.html file that gets added to the app’s head.
My final google-analytics.html file will look like this:
google-analytics.html
<!-- Global site tag (gtag.js) - Google Analytics -->
<script async src="https://www.googletagmanager.com/gtag/js?id=GT-XXXXXX"></script>
<script>
  window.dataLayer = window.dataLayer || [];
  function gtag(){dataLayer.push(arguments);}
  gtag('js', new Date());

  gtag('config', 'GT-XXXXXX');

  $(document).on('change', 'select', function(e) {
    gtag('event', 'widget', {
      action: 'select data',
      label: $(e.currentTarget).val()
    });
  });

  $(document).on('click', 'button', function() {
    gtag('event', 'button', { action: 'update plot' });
  });
</script>
I’ll need to redeploy the app to https://shinyapps.io to make sure the hosted version of the app uses this code.
Step 5 - Collect reports
Once you have set up your app to use Google Analytics, you can use your account portal as a dashboard to track traffic on your app. The Real-Time tracking features should begin almost immediately, but other tracking features may take a couple hours to a couple days before they start reporting results.
You can also extract and analyze traffic data from Google Analytics data with R. The googleAnalyticsR package has extensive documentation with some examples.
Add Google Analytics with Shiny Server Open Source and Shiny Server Pro
Alternatively, you can use Shiny Server to add Google Analytics to your apps. This will let you manage your Google Analytics configuration at a higher level—so if you want all apps deployed on a server to share Google Analytics code, you could put this code at the top level of your config and all your apps would automatically inherit it. To learn more, visit the Shiny Server user guide.
Recap
To add Google Analytics to a Shiny app:
- Set up a Google Analytics account.
- Add the Shiny app to the account as a web property.
- Place the Google Analytics tracking script into the head section of your app’s DOM.
- Create event trackers to track specific events within your app. The easiest way to do this is to modify Shiny widgets with delegated event handlers managed by jQuery.
- Use R or your Google Analytics dashboard to explore the results.
Google Analytics isn’t the only website monitoring service, but it is the most popular. You can add similar services to your app with the same techniques.
These techniques serve as a proof of concept that will allow you to track how visitors use your apps. We will look to make it easier to track Shiny apps in future development.