Displaying and customizing static tables
The renderTable app demonstrates how to use the improved renderTable() Shiny function.

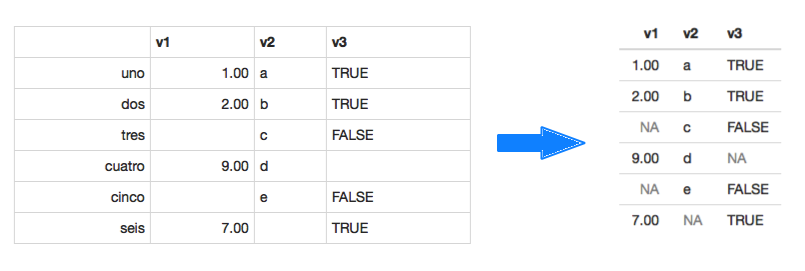
Like its predecessor, renderTable()should be used to render static tables in a Shiny app or a runtime: shiny document. However, the resulting table is now neater and more in line with Bootstrap table styles (you can see the differences between the two default implementations in the image above). In addition, you can also customize the table to a much greater extent than before.
The most basic use of renderTable() remains the same: renderTable({ yourData }). In addition, you might have passed some arguments to xtable() and print.xtable() through the ... argument. These will still work. But it is worth to note that many of the arguments you may have used (e.g. align, digits, width) are now made explicit as direct arguments to renderTable(). Even if you didn’t use any extra aguments, however, the finished look of your table will be quite a bit different, as the image above shows. By default:
- the table’s width is as small as possible, with only some padding between columns;
- the row numbers are ommited;
- only the cells’ top border remains;
- column headers’ and column values’ alignments match;
NAvalues are shown in gray;- the height of each row is slightly smaller.
But if you don’t like these, fret not! All of these are customizable. Take a look at the documentation, or better yet, the interactive demo app, to experiment with all of the new renderTable() arguments.