Save your app as a function
Shiny apps are a great way to build interactive data analysis tools, but they require a bit of set up to use. Or do they? This article will show you how to write R functions that launch Shiny apps.
The result is a quick tool that you can reuse on any data set (or with any set of arguments that you like). Moreover, you can use this method to share your Shiny apps as straightforward R functions.
An example
rmdexamples::kmeans_cluster is a function that launches a Shiny app. It takes one argument, a data frame, and launches a cluster analysis app that explores the data frame.
You can install the rmdexamples library from github. To do so, run
devtools::install_github("rmdexamples", "rstudio")

library(rmdexamples)
kmeans_cluster(iris)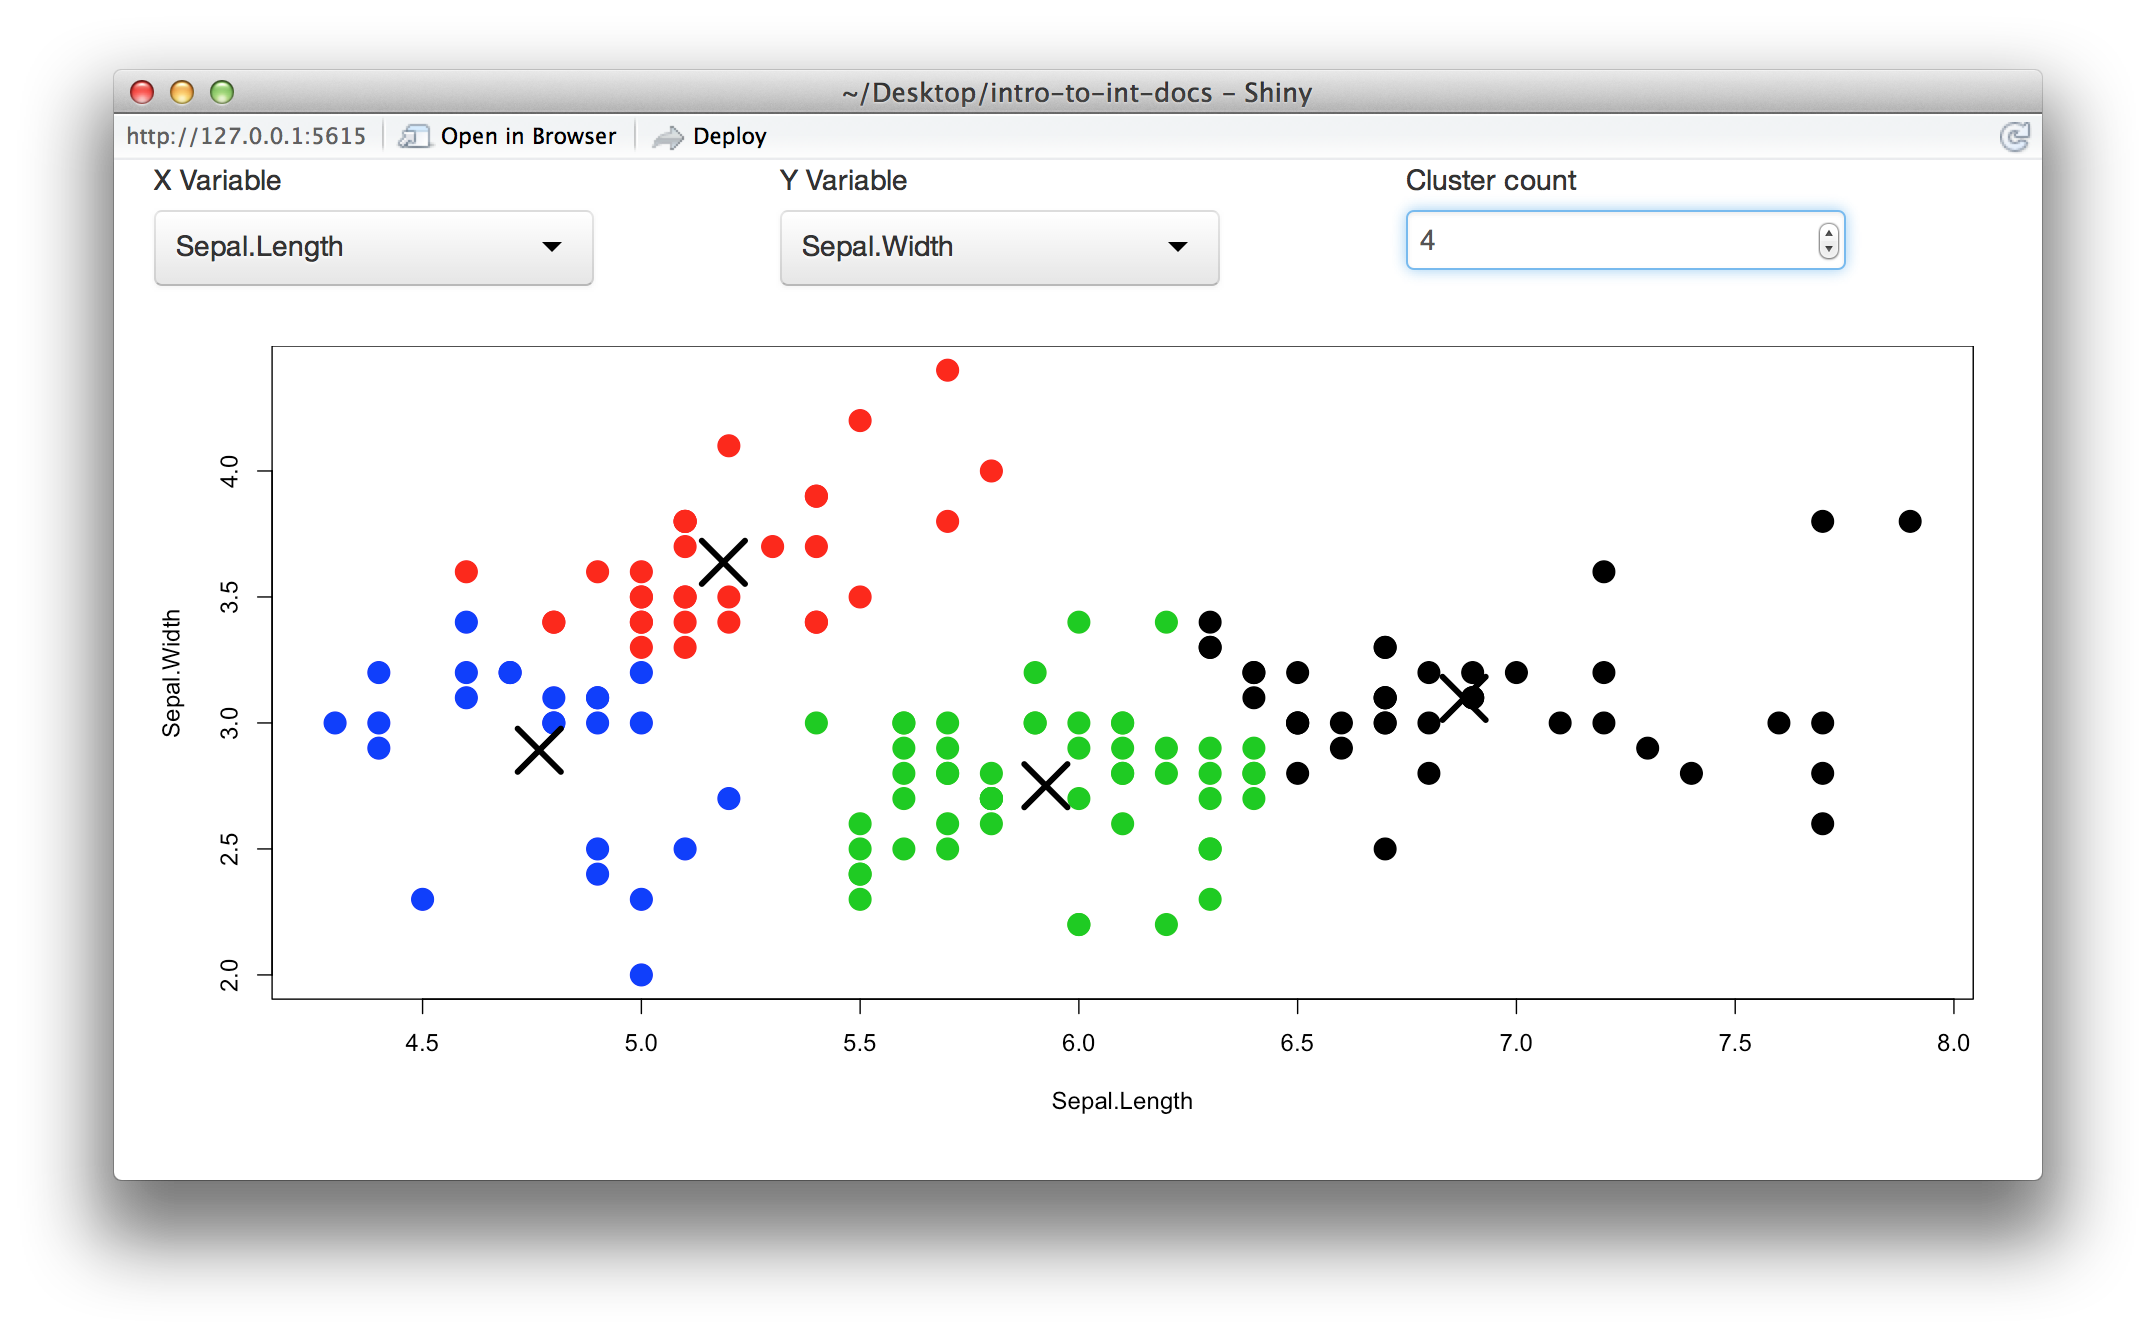
The following sections will show you how to
- Define a Shiny app in a single script with
shinyApp - Save your app as a parameterized function
- Launch your app from the command line or inside an interactive document
shinyApp
shinyApp is a function that builds Shiny apps. You can use shinyApp to define a complete app in a single R script, or even at the command line.
shinyApp builds an app from two arguments that parallel the structure of a standard Shiny app. The ui argument takes code that builds the user interface for your app, and the server argument takes code that sets up the server for your Shiny app.
When you build a standard Shiny app, you save two files in your working directory and then call runApp(). One file, named ui.R, contains a call to shinyUI. The second file, named server.R, contains a call to shinyServer.
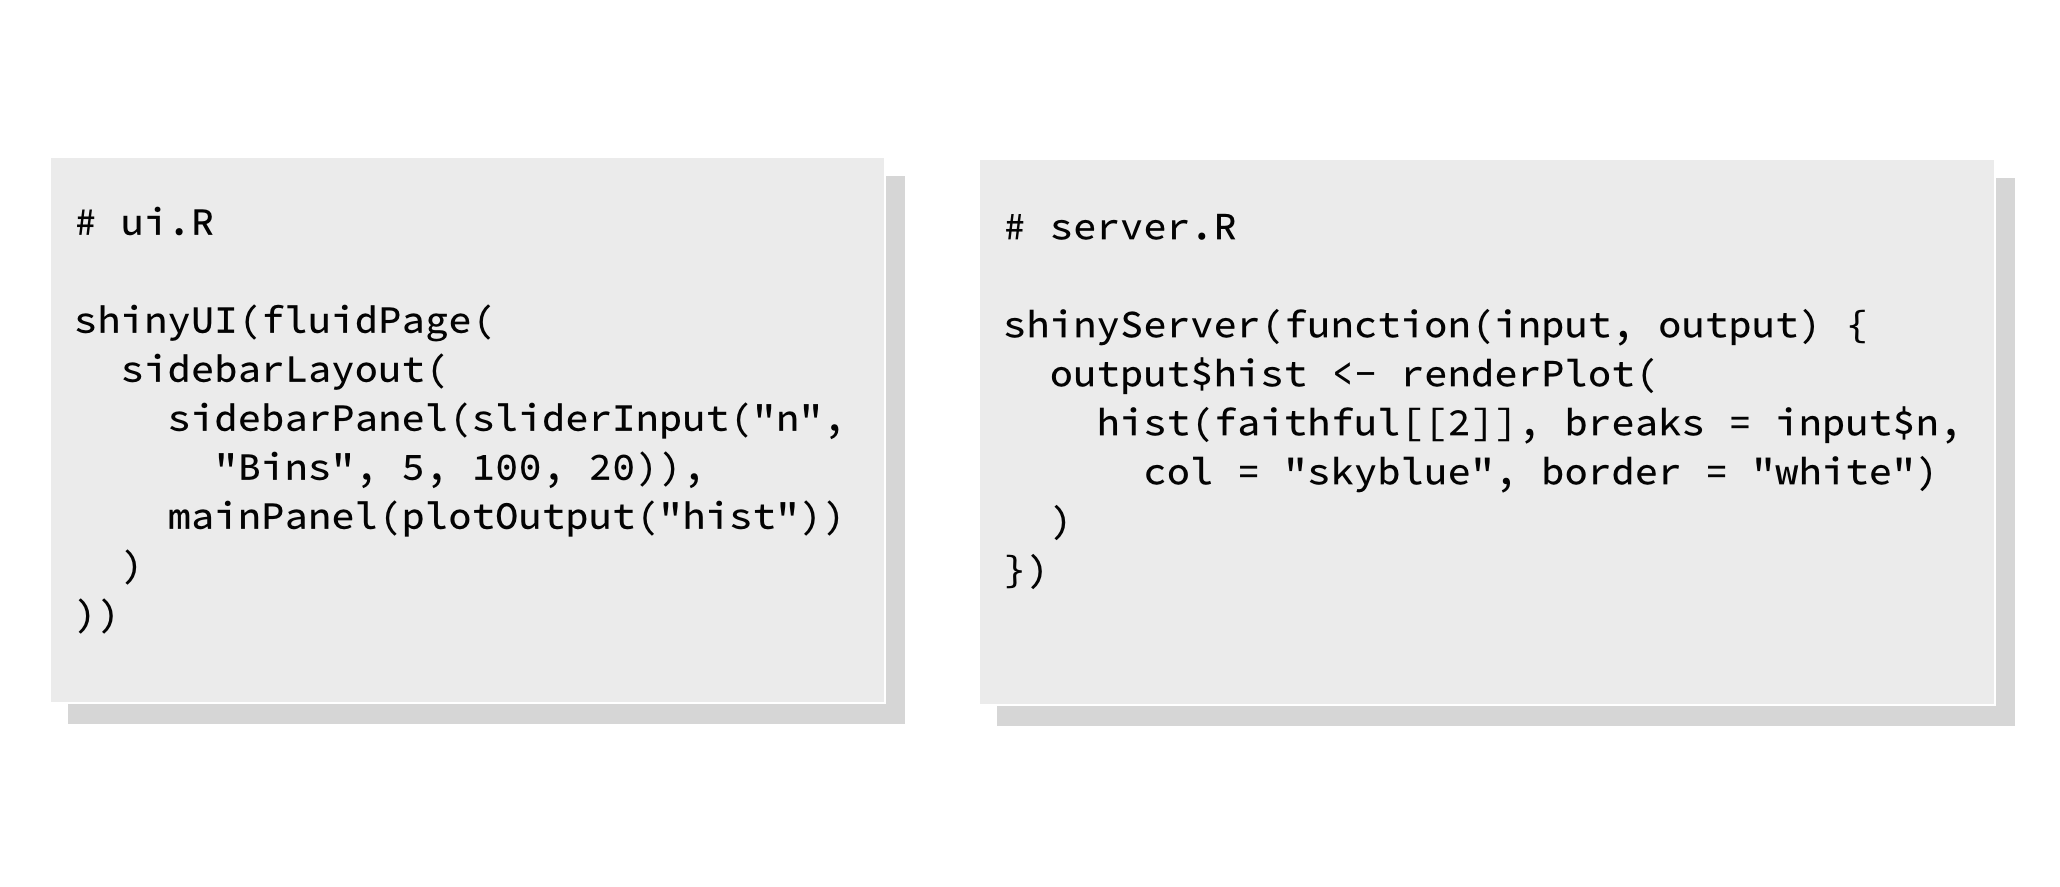
To build an app with shinyApp, give ui the code that you would normally pass to shinyUI in a ui.R file. Then give server the code that you would normally pass to shinyServer in a server.R file.
shinyApp(
  ui = fluidPage(
    sidebarLayout(
      sidebarPanel(sliderInput("n", "Bins", 5, 100, 20)),
      mainPanel(plotOutput("hist"))
    )
  ),
  server = function(input, output) {
    output$hist <- renderPlot(
      hist(faithful[[2]], breaks = input$n,
        col = "skyblue", border = "white")
    )
  }
)
R will build and launch your app when you run the complete shinyApp call at the command line.
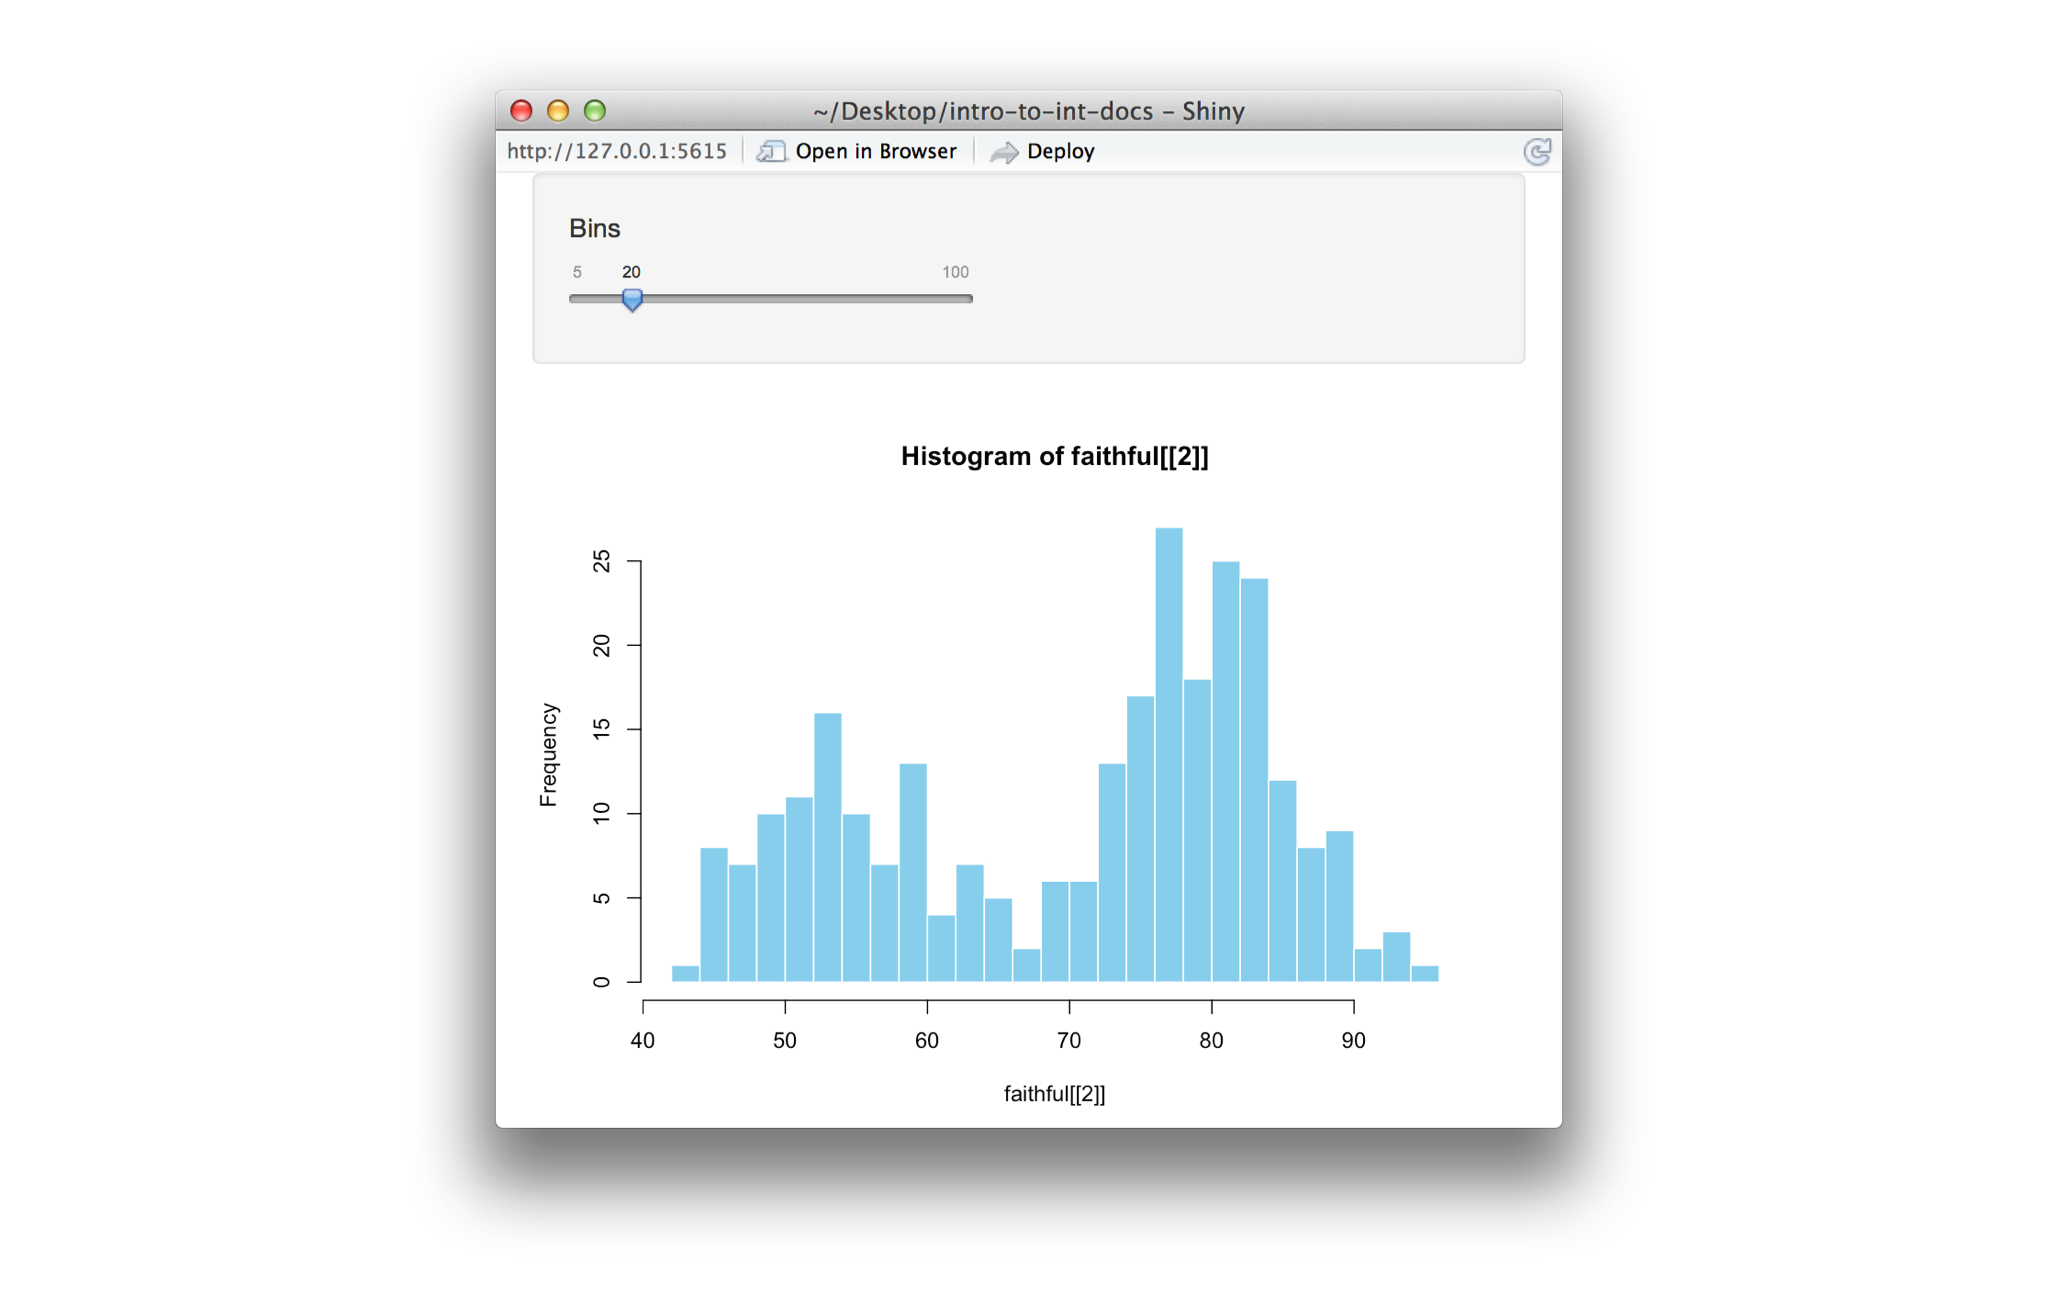
For example, the code above will build a minimal Shiny app. When you run the code, your app will look like this.
shinyApp also uses an option argument, which takes a list of named options. You can use the option argument to set any options that you would normally set in a runApp call.
In addition, you can use the option argument to provide a hint to the browser environment about the ideal height and width of your Shiny app. This becomes very useful when you embed Shiny apps in R Markdown documents (described below). The code below will launch an app that has a suggested size of 600 by 500 pixels.
shinyApp(
  ui = fluidPage(
    sidebarLayout(
      sidebarPanel(sliderInput("n", "Bins", 5, 100, 20)),
      mainPanel(plotOutput("hist"))
    )
  ),
  server = function(input, output) {
    output$hist <- renderPlot(
      hist(faithful[[2]], breaks = input$n,
        col = "skyblue", border = "white")
    )
  },
  options = list(height = 600, width = 500)
)
Save your app as a function
To turn your app into a function, write a function that calls shinyApp. Parameterize your app by passing function arguments to shinyApp.
The code below saves the histogram app as a function named binner that takes a vector named var. The function passes its var argument to shinyApp, which then launches an app that visualizes var.
binner <- function(var) {
  require(shiny)
  shinyApp(
    ui = fluidPage(
      sidebarLayout(
        sidebarPanel(sliderInput("n", "Bins", 5, 100, 20)),
        mainPanel(plotOutput("hist"))
      )
    ),
    server = function(input, output) {
      output$hist <- renderPlot(
        hist(var, breaks = input$n,
          col = "skyblue", border = "white")
      )
    }
  )
}
Since var is a function argument, you can supply it at runtime. This means you can reuse the app on many different data frames.
Call your app as a function
You can launch your app from the command line once you define your function. To do this, call the function and supply a value for each function argument.
For example, you can now use binner to explore various vectors.
binner(faithful$eruptions)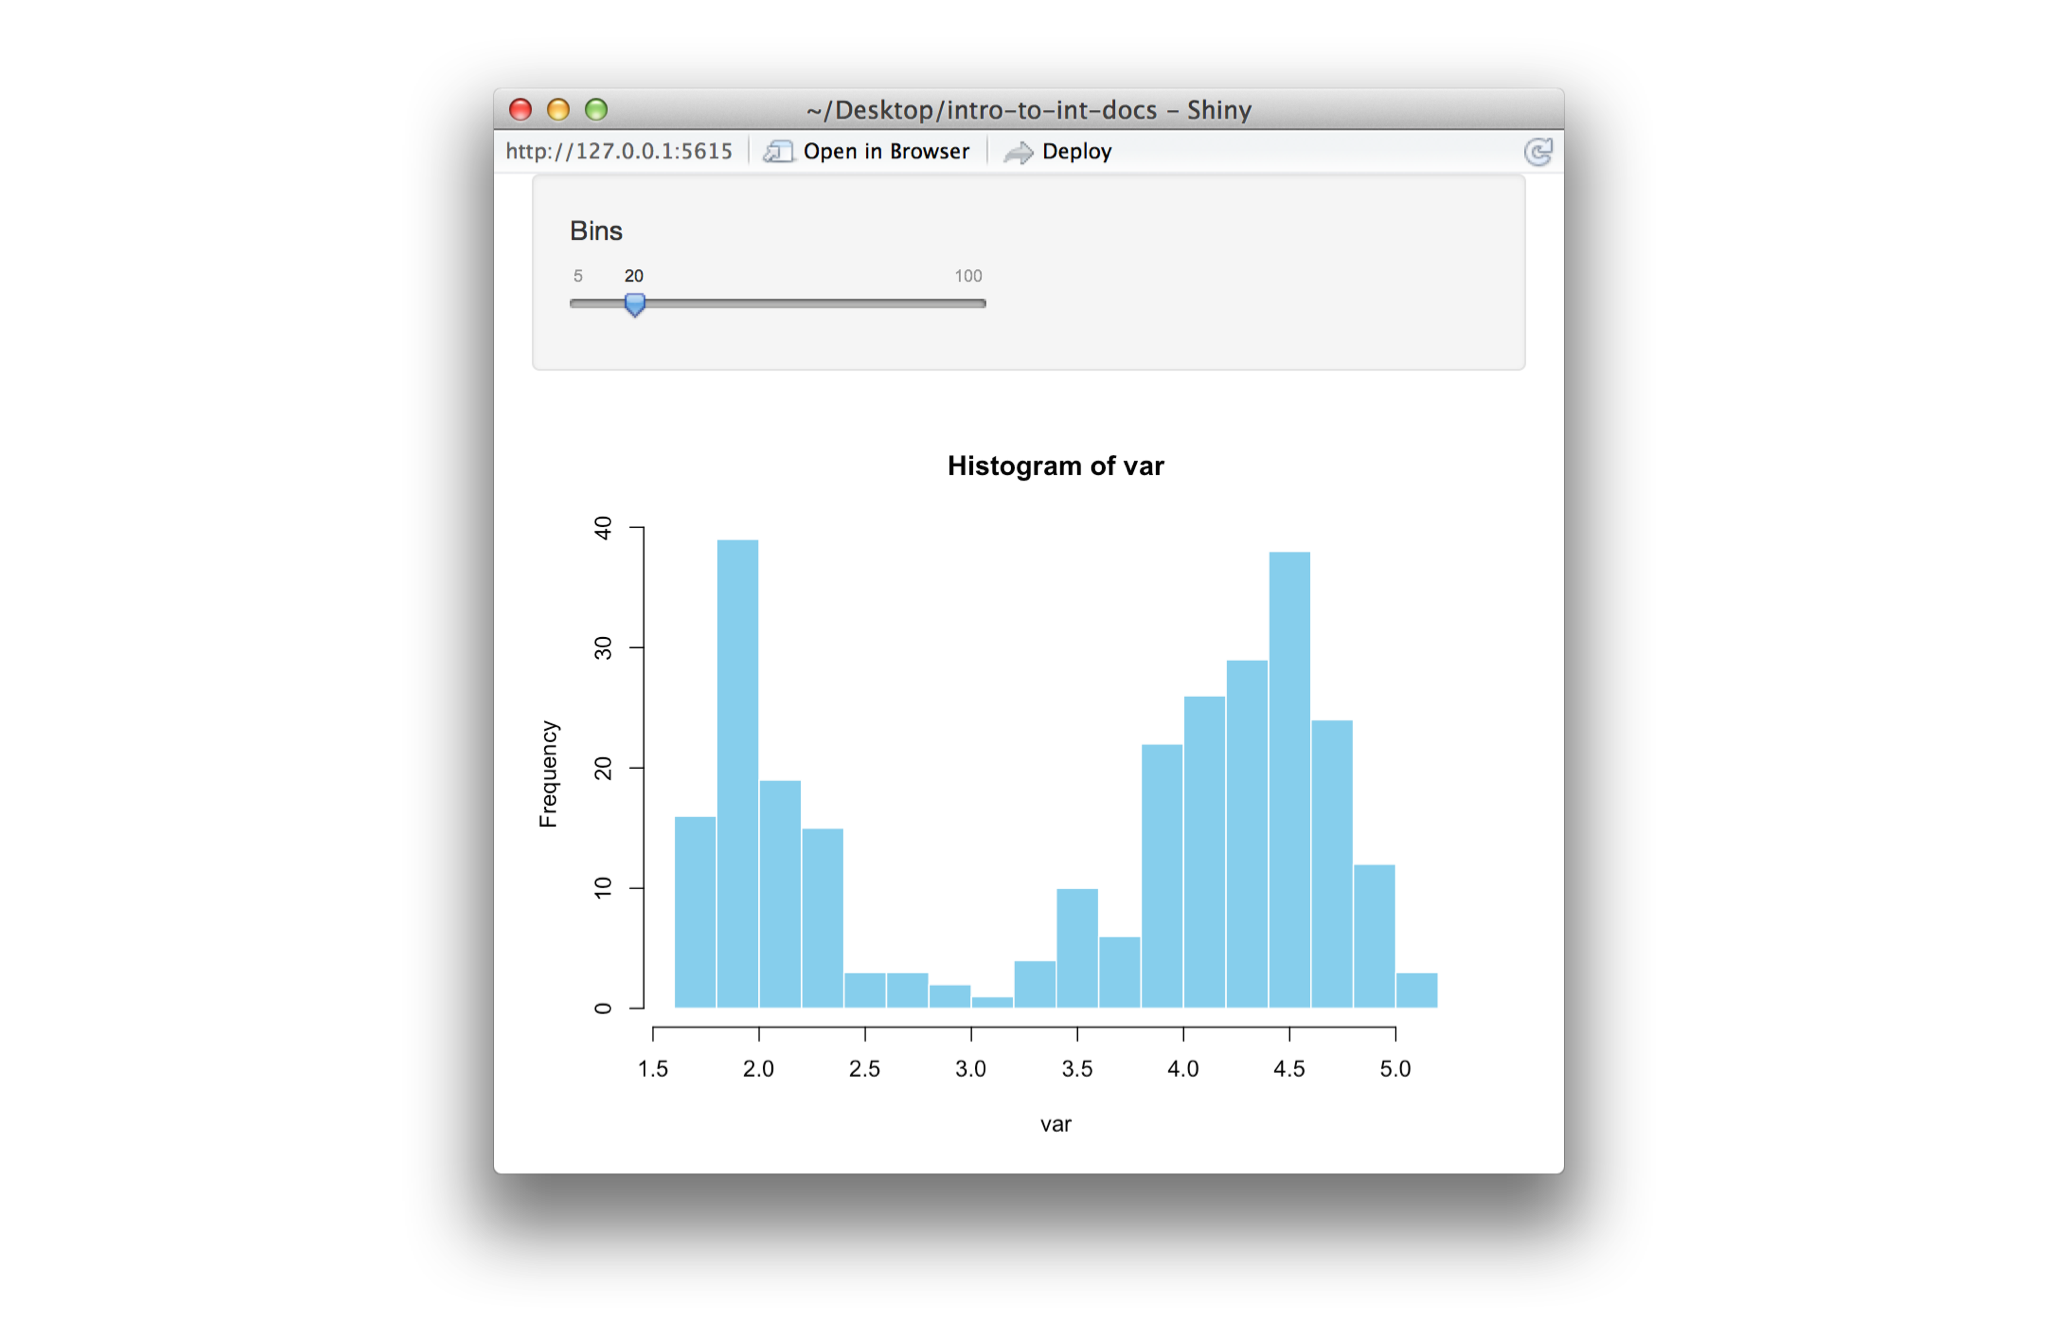
binner(iris$Sepal.Length)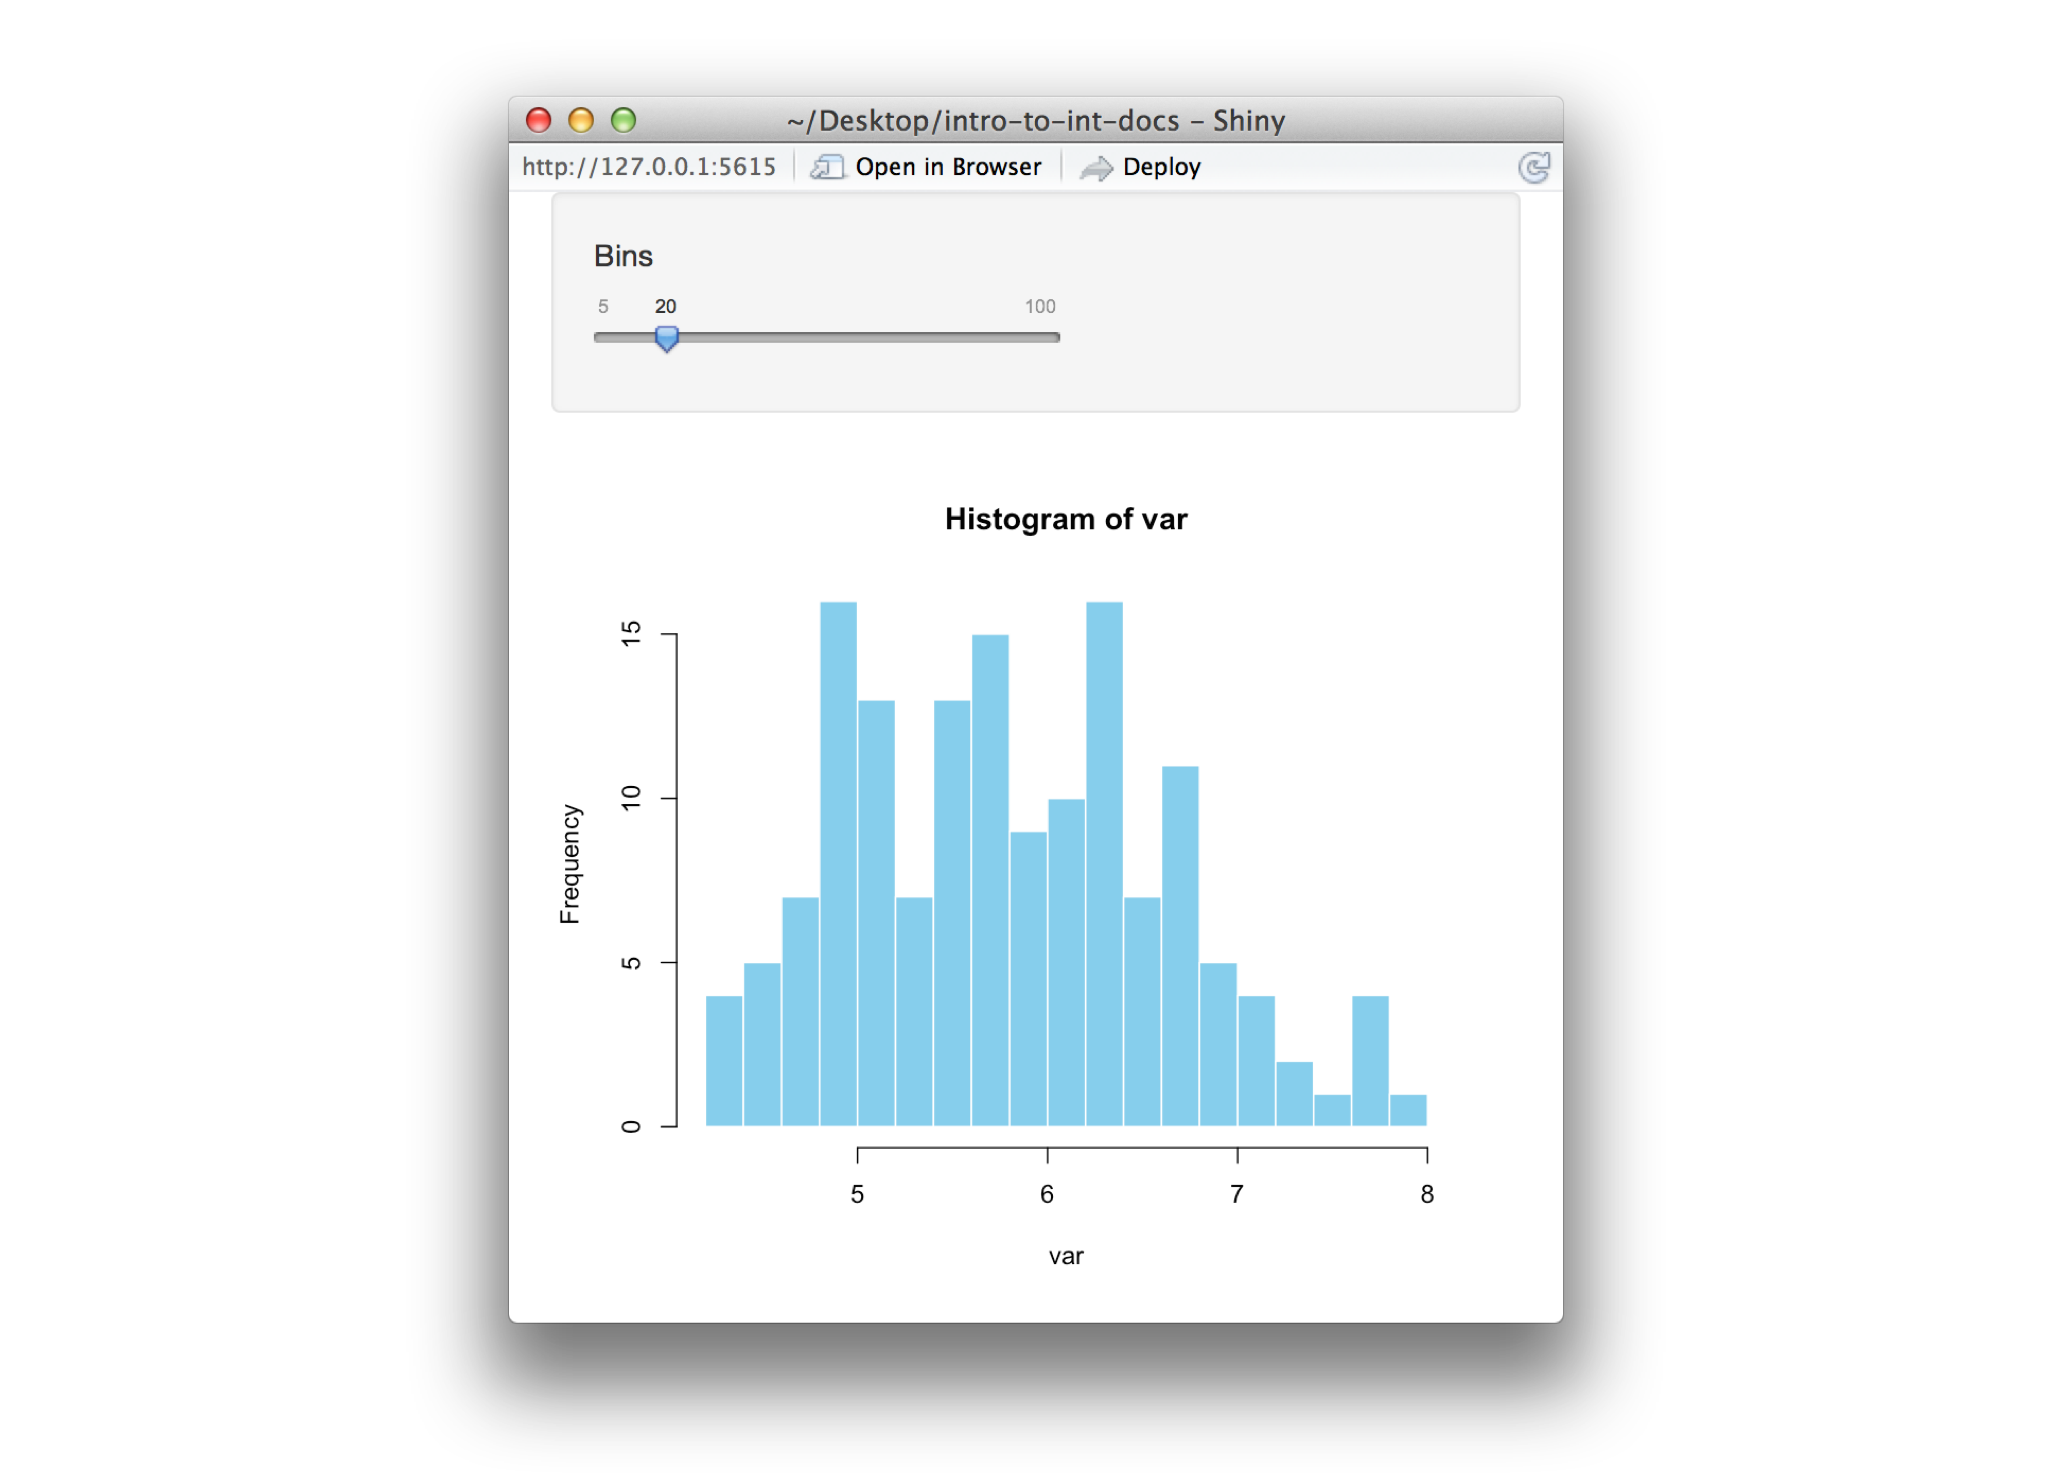
binner(mtcars$mpg)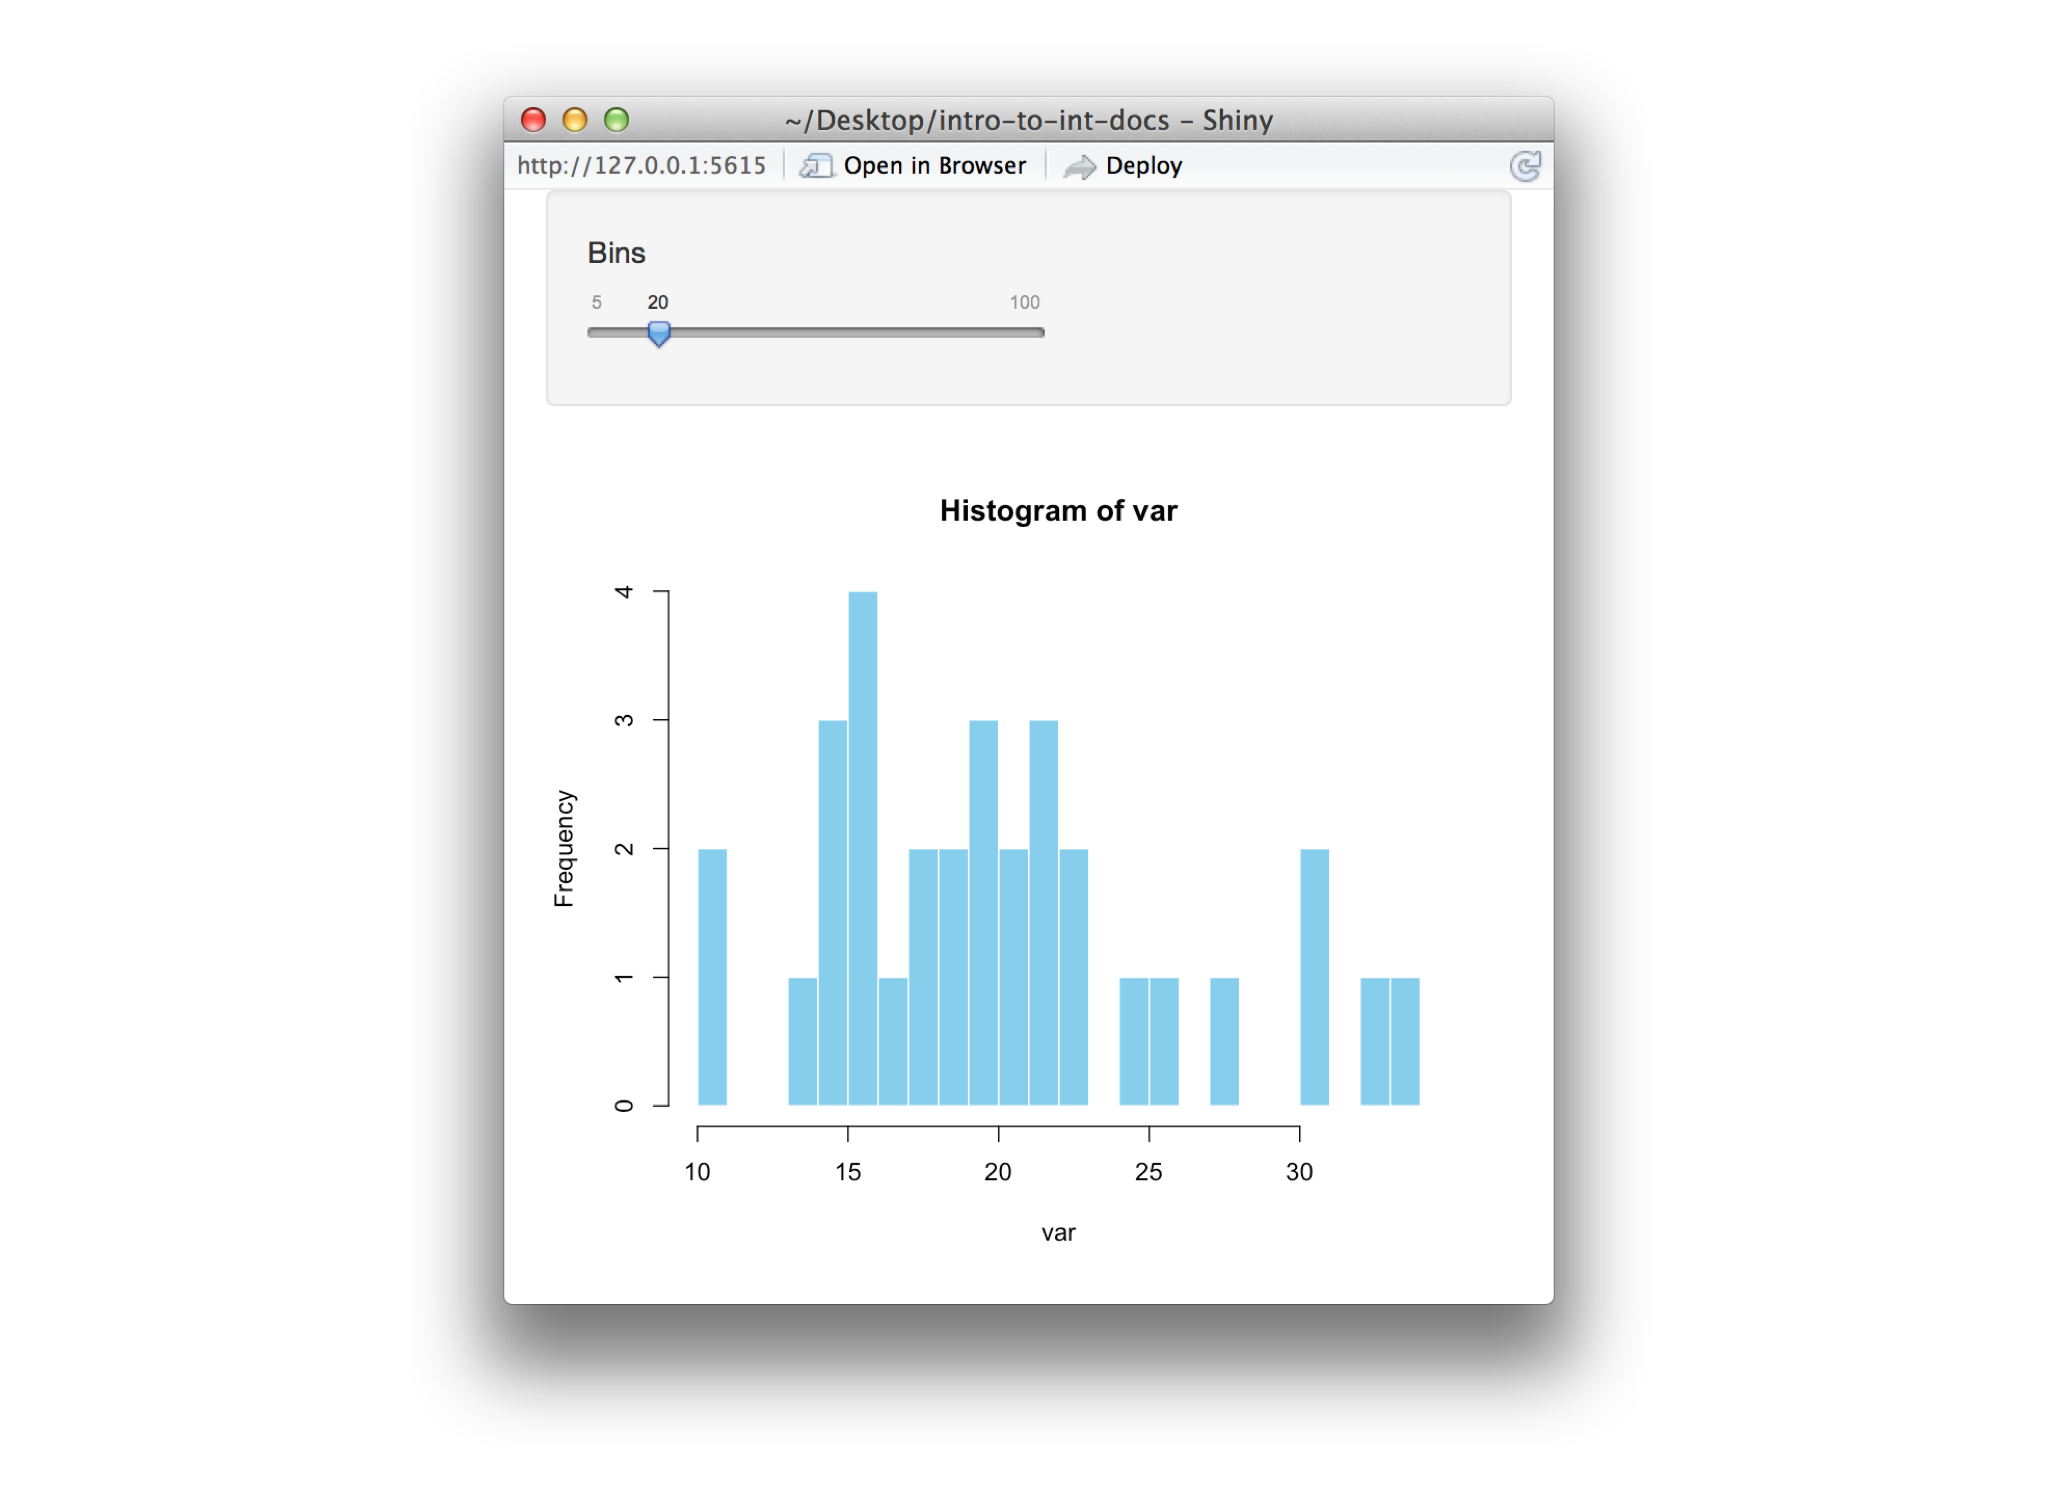
Embed your app in an interactive document
You can also embed your app in R Markdown reports. Define the function that launches your app in an R code chunk (by including the definition, or loading a package that has the function). Then call the function.
The R Markdown script below places binner in an interactive document.
---
runtime: shiny
output: html_document
---

```{r echo = FALSE}
binner <- function(var) {
  require(shiny)
  shinyApp(
    ui = fluidPage(
      sidebarLayout(
        sidebarPanel(sliderInput("n", "Bins", 5, 100, 20)),
        mainPanel(plotOutput("hist"))
      )
    ),
    server = function(input, output) {
      output$hist <- renderPlot(
        hist(var, breaks = input$n,
          col = "skyblue", border = "white")
      )
    }
  )
}
```

## Old Faithful

Old faithful tends to erupt at regular intervals (hence its name). But how regular are these intervals?

I went to Yellowstone national park and monitored the old faithful geyser during fourteen days. During this time I wrote down the exact number of minutes that passed between each eruption.

Just kidding, I used the `faithful` data set which comes with R. It contains the same information. Below is a histogram of the results. As you can see the times are bimodal. Old faithful is not entirely faithful; it appears to have a mistress on the side.

```{r echo = FALSE}
binner(faithful$waiting)
```
The document looks like this when you render the report. The binner app is interactive in the final document (try it!)
Recap
You can package your Shiny apps as parameterized R functions. To do this, define a function that builds your app with shinyApp.
Why would you save your Shiny apps this way? Saving your app as a function opens several opportunities
Easy to share - you can share your apps with other R users just as you would share functions. For example, you can put your apps in an R package very easily.
Reusable - it is very easy to reuse your apps on new data sets, or with new conditions, by parameterizing your apps.
A Chance to be a Hero - you can create and share apps that any R user can use. Your users do not need to know Shiny; they only need to call a function. You can use this method to make packages that contain interactive data exploration tools, teaching examples and quizzes, gui versions of R programs, and much more.